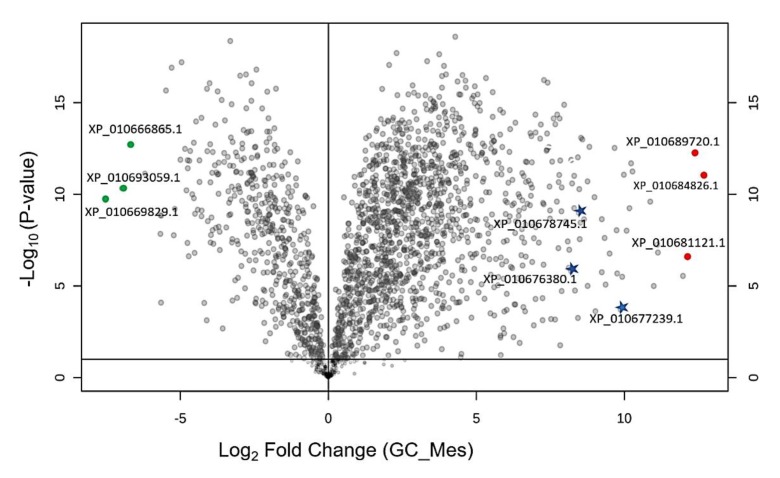
Figure 4.
Comparison of differently abundant proteins in mesophyll and guard cells. Volcano plots displaying differentially abundant proteins in mesophyll and guard cell (FDR < 0.05). Three proteins with highest abundance and three proteins with lowest abundance in guard cells (GC) relative to mesophyll are marked in red and green, respectively. GC: guard cell; Mes: mesophyll, C: control conditions, S: saline conditions (300 mM NaCl).

