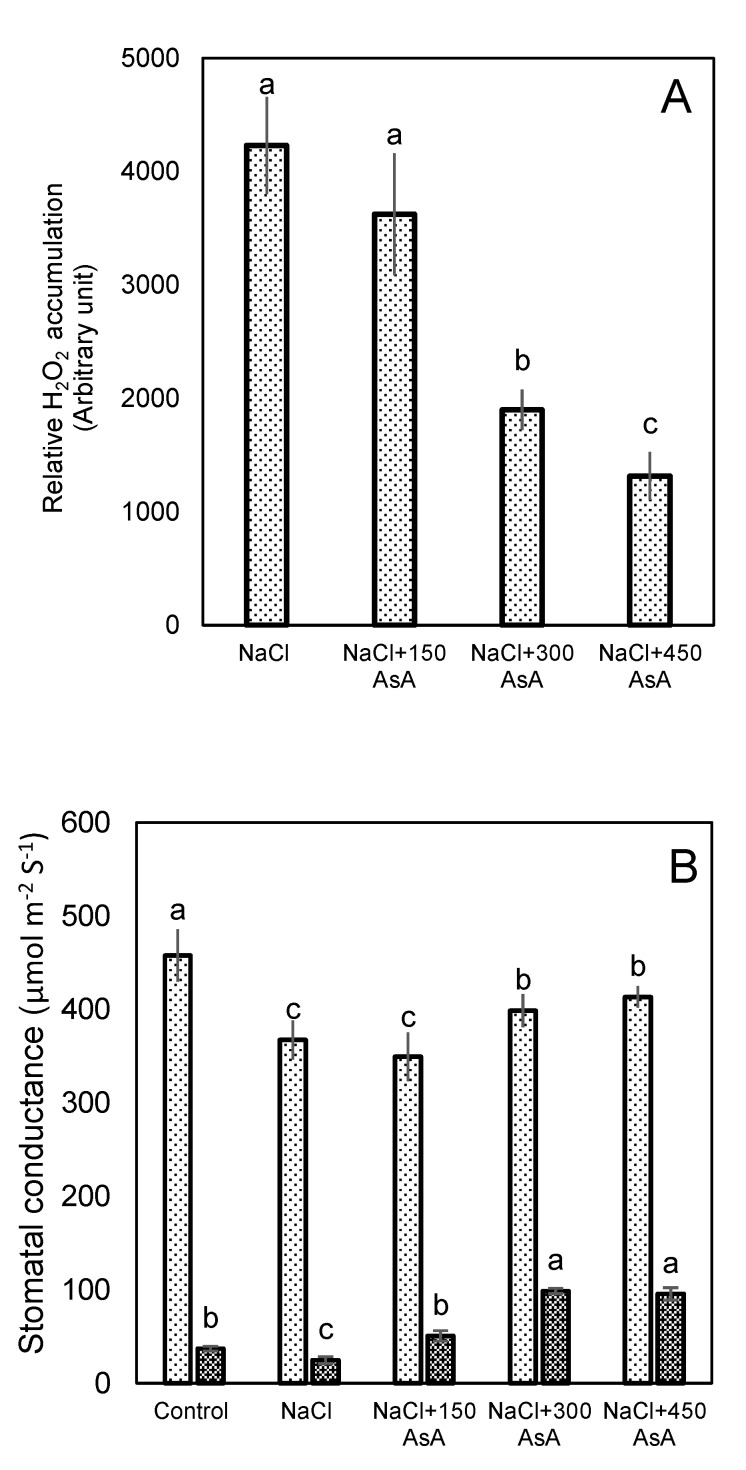
Figure 12.
(A) Effect of different concentrations of ascorbic acid on H2O2 of levels in the GCs of sugar beet plants grown under saline conditions, relative to non-stressed controls. Relative signal intensities of DAB staining were quantified using ImageJ software. (B) Stomata conductance in non- stressed sugar beet leaves and salt- stressed leaves with or without ascorbic acid treatment. The light bar and dark bar are stomata conductance measurements under natural light conditions and under 30 min-dark conditions, respectively. Values are means of 5 replicates ± SE. Data labeled with different lower-case letters are significantly different at p < 0.05.

