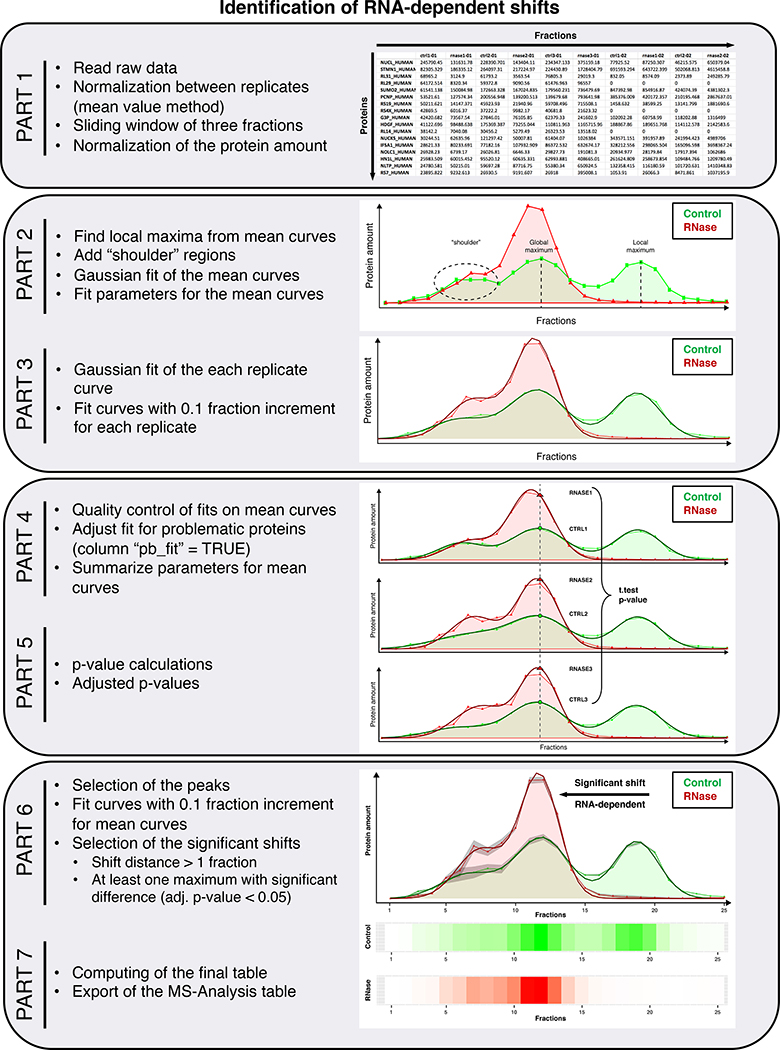
Fig. 7 |. Workflow of the statistical analysis.
The pipeline is divided into seven parts, which include: a normalization step between the replicates and overall normalization (PART 1), a search for the starting parameters in order to fit all the distribution profiles using Gaussian curves (PART 2 and 3), a quality control of the fit with subsequent correction if needed (PART 4), the assessment of the p-value and adjusted p-values (adj. p-value, PART 5), and the evaluation of the shifts and subsequent selection of the significant shifts (PART 6). Lastly, a final table is computed and exported for further analysis (PART 7).

