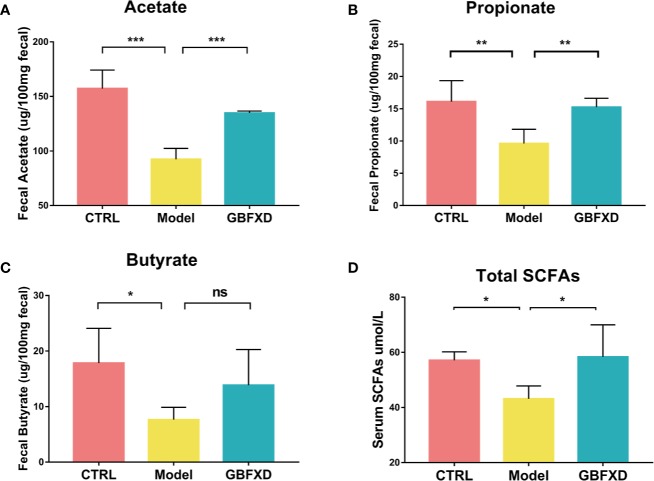
Figure 4.
GBFXD increased the levels of total SCFAs in serum, and acetate and propionate levels in the feces. (A–C) Acetate, Propionate, and Butyrate concentrations in feces. (D) Total SCFAs concentrations in serum. Data are shown as mean ± SD, n = 5 mice per group. Data in (A–C) were analyzed by one-way ANOVA with Dunnett’s post hoc tests for multiple comparisons. Data in (D) were analyzed by Kruskal-Wallis test with Dunn’s multiple comparisons. *P < 0.05, **P < 0.01, ***P < 0.001 compared to Model group. ns means no statistical significance.

