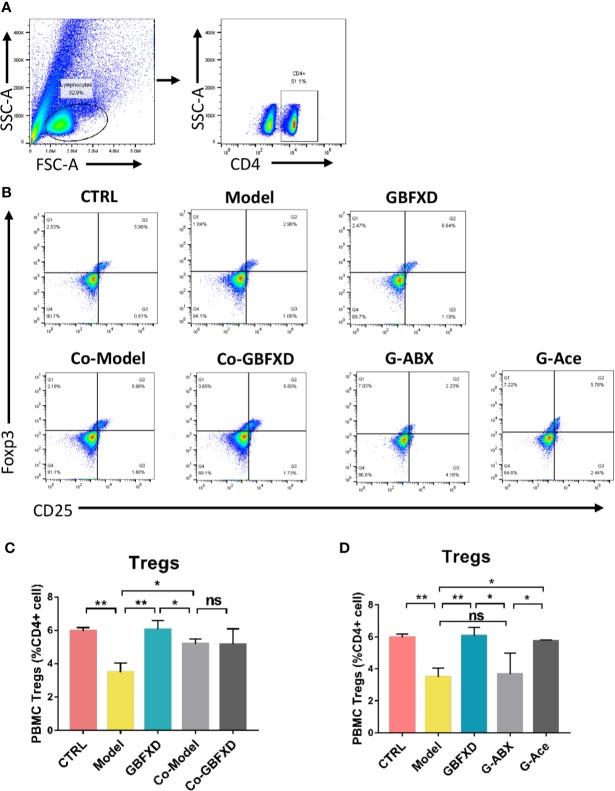
Figure 7.
Acetated supplement recovered the ABX-induced reduction of Treg cells. (A, B) Representative flow cytometry analysis demonstrating Treg cell expression in PBMC subsets. (C, D) Treg cell expression in PBMC using FCM. Data were shown as mean ± SD, n = 3 mice per group. Data were analyzed by one-way ANOVA with Tukey’s post hoc tests for multiple comparisons. *P < 0.05, **P < 0.01 compared to the indicated group. ns means no statistical significance.

