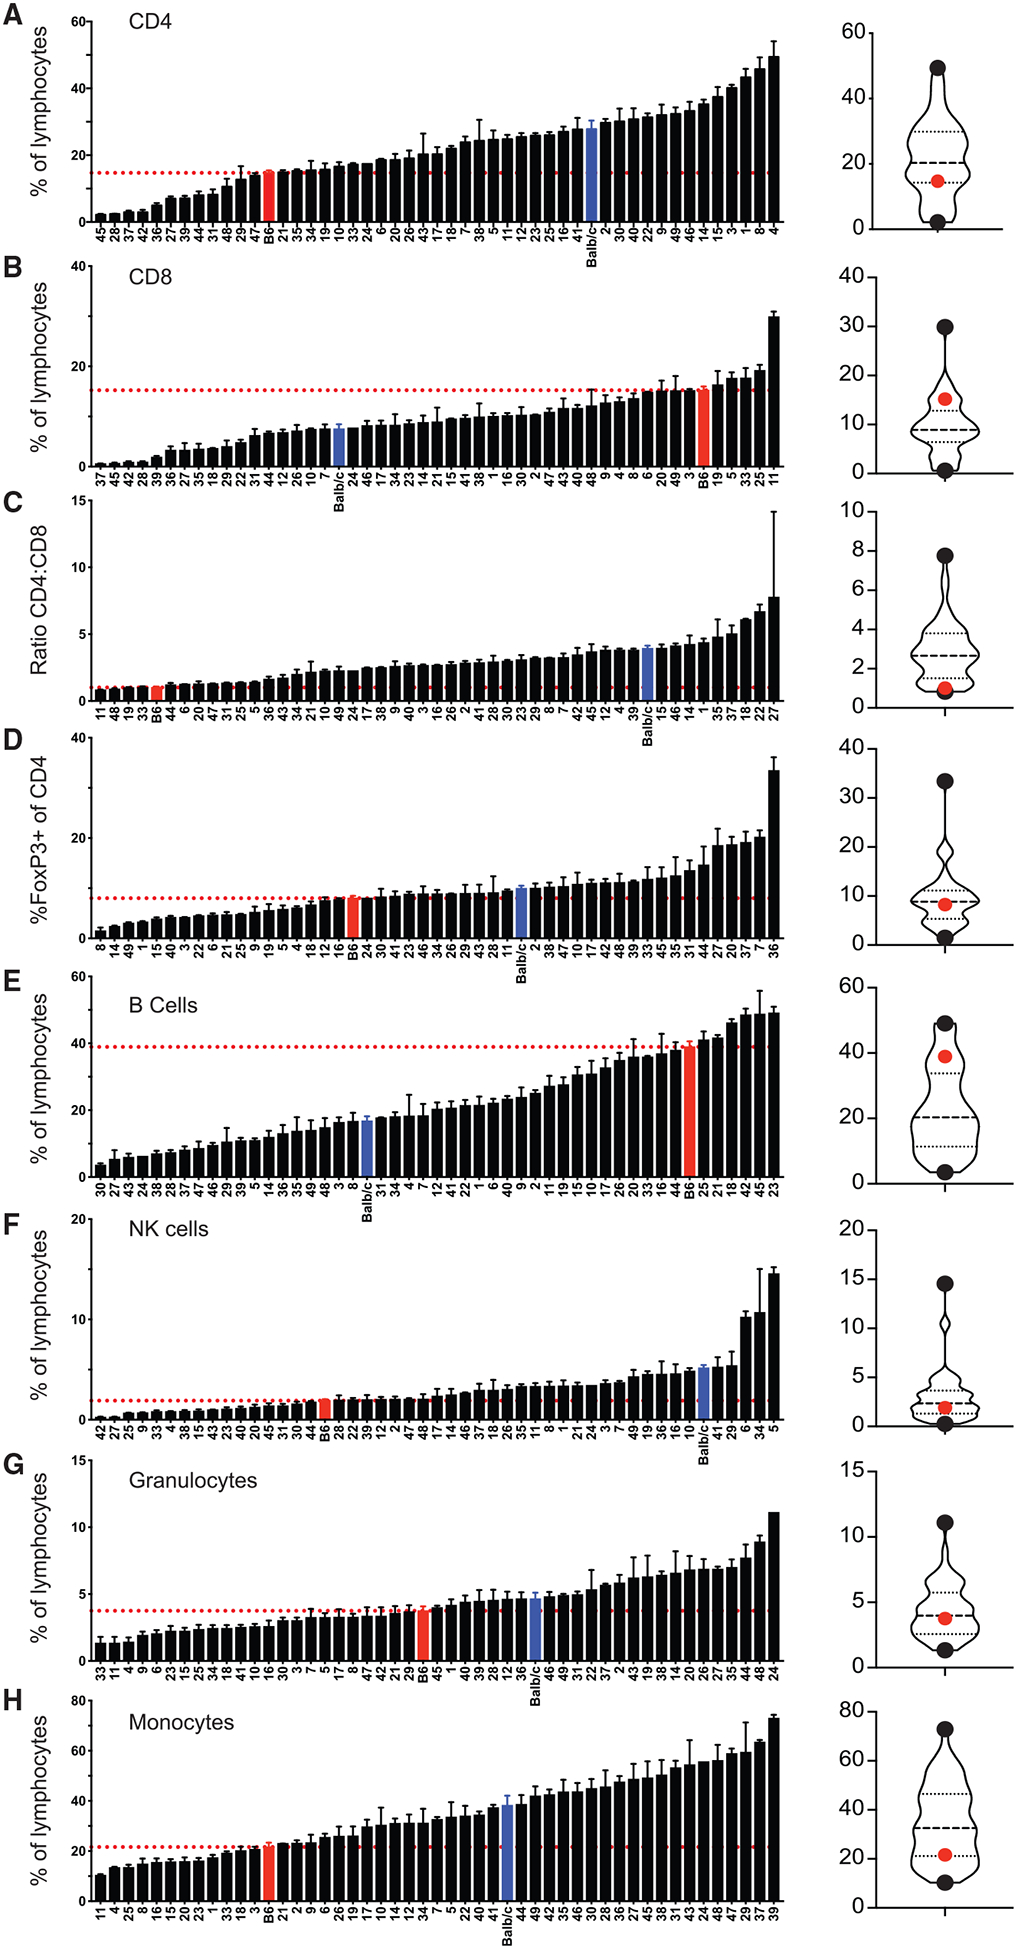
Figure 1. CC Mice Display Variation in Immune Subset Composition prior to Infection.

Summary graphs (left) and violin plots (right) of the percentage of CD4 (A) and CD8 (B) T cells out of total lymphocytes, ratio of CD4 to CD8 T cells (C), Foxp3+ cells of gated CD4 T cells (D), B cells (E), NK cells (F), granulocytes (G), and monocytes (H) out of total lymphocytes for uninfected B6 (red), BALB/c (blue), and CC (Hotchkiss, no. 22) strains. Data are from 1–3 individual experiments. n = 1–20 mice per group (see Table S1). Error bars for summary graphs indicate standard error of the mean and dashed red lines at percentage seen in B6 mice. For violin plots, black dots indicate collaborative cross strains with highest and lowest percentages and red dots indicate percentage in B6 mice. Dashed lines at 25th and 75th quartiles and median are shown. See also Figure S1 and Table S2.
