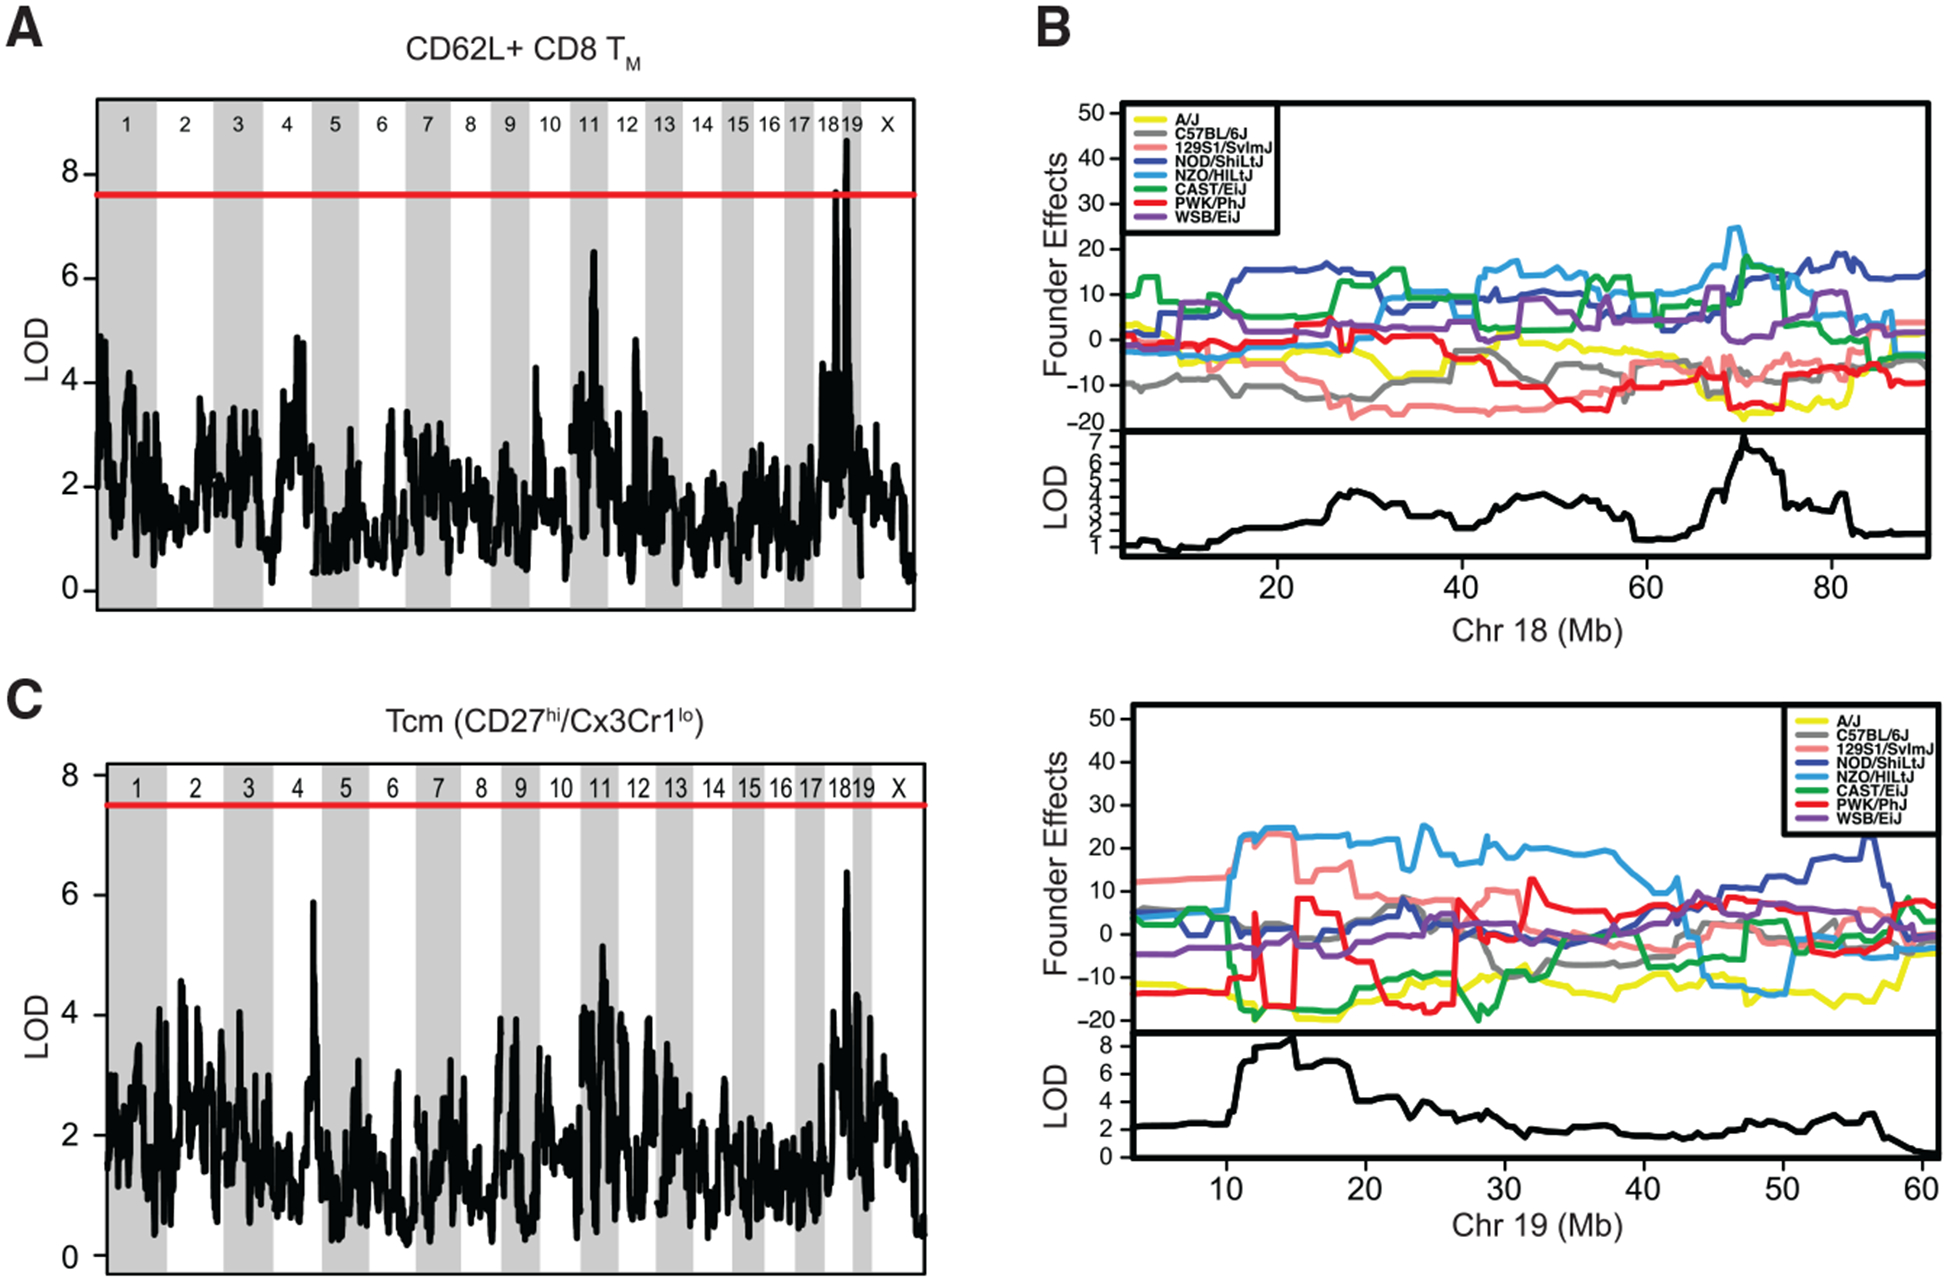
Figure 6. Significant QTLs within Chromo somes 18 and 19 Drive the Frequency of CD62L+ CD8 TM Cells.

(A) QTL analysis for chromosomal regions associated with frequency of CD62L+ CD8 TM cells. Significant QTLs were found within chromosome 18 at position 60–80 Mb and within chromosome 19 at position 10–20 Mb. (B) Analysis of founder effects associated with the significant QTL within chromosome 18 revealed a correlation with inheritance from NOD/ShiLtJ, CAST/EiJ, and NZO/HILtJ and high frequency of CD62L+ CD8 TM cells and inheritance from A/J and PWK/PhJ with low frequency of CD62L+ CD8 TM cells (top). Analysis of founder effects associated with the significant QTL within chromosome 19 revealed a correlation with inheritance from 129S1/SvImJ and NZO/HILtJ with high frequency of CD62L+ CD8 TM cells and inheritance from A/J, CAST EiJ, and PWK/PhJ with low frequency of CD62L+ CD8 TM cells (bottom). (C) QTL analysis for chromosomal regions associated with Tcm (Cx3Cr1lo/CD27hi) CD8 TM subset representation revealed a trending QTL at the same region within chromosome 18, driving frequency of CD62L+ CD8 TM cells.
Data from 1–3 individual experiments. In (A) and (C), the solid red line indicates the threshold for an LOD score with p < 0.05. See also Figure S7 and Tables S5, S6, and S7.
