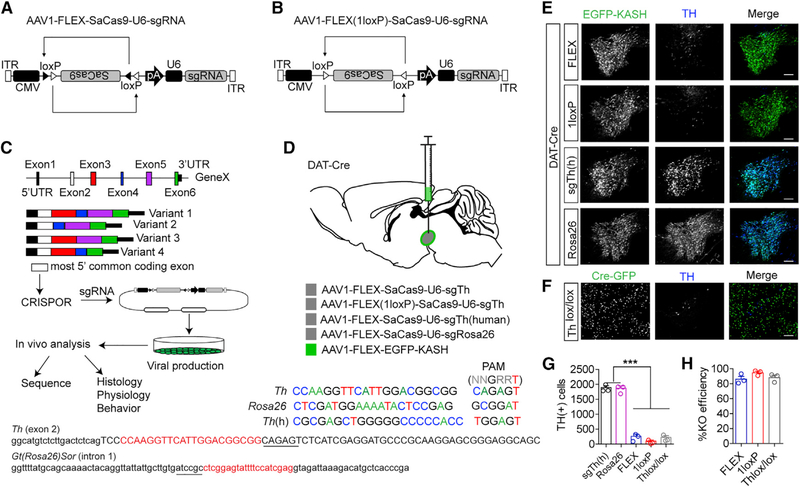
Figure 1. Generation of Single Vector CRISPR/SaCas9.
A) Design of AAV-FLEX-SaCas9-U6-sgRNA.
(B) Design of AAV-FLEX(1LoxP)-SaCas9-U6-sgRNA.
(C) Schematic for designing, generating, and analyzing CRISPR AAVs.
(D) Illustration of viral injections into the VTA and guide sequences for Th, Gt(Rosa26)Sor, and Th(h). Exon 2 of Th containing the sequence of the guide is denoted; note that lowercase is intron sequence and uppercase is exon. The intronic sequence containing the guide for Gt(Rosa26)Sor is also denoted, and PAMs are underlined.
(E) Example images of coronal VTA sections co-stained for EGFP (for identifying virally transduced and Cre-positive neurons using AAV1-FLEX-EGFP-KASH) and tyrosine hydroxylase (TH; a marker for dopamine neurons) showing loss of TH staining in the 1loxP and FLEX strategies compared with controls.
(F) Example images of coronal VTA sections co-stained for GFP and TH in Thlox/lox mice injected with AAV1-CAG-Cre-GFP. Scale bars: 250 mm.
(G) Cell count quantification of VTA TH-positive cells (n = 3 mice/group; one-way ANOVA F[4, 10] = 214.3, p < 0.0001; Tukey’s multiple comparisons test, ***p < 0.001).
(H) Comparison of knockout efficiencies among the FLEX, 1LoxP, and Thlox/lox strategies. Data are presented as mean ± standard error of the mean (SEM).

