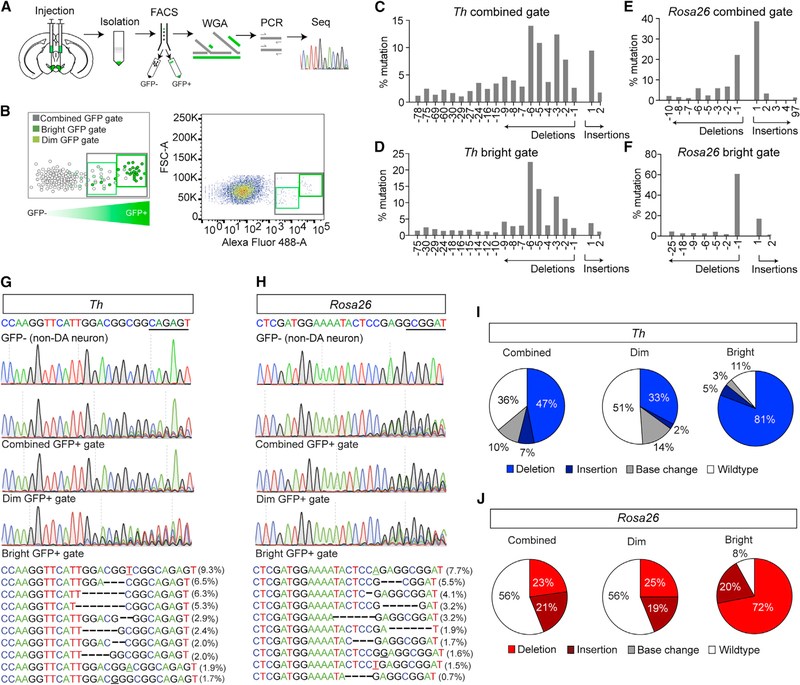
Figure 2. Analysis of Cell Type-Specific Mutagenesis.
(A) Schematic for isolation, FACS, WGA, PCR, and sequencing (seq) for identifying indels at targeted sites.
(B) Schematic of FACS illustrating designated gates (left) and example FACS (right).
(C and D) Indel frequencies for the combined gate (C) and bright gates (D) for targeted analysis of Th.
(E and F) Indel frequencies for the combined gate (E) and bright gates (F) for targeted analysis of Gt(Rosa26)Sor.
(G and H) Sanger sequencing of FACS sorted GFP-negative (top) and GFP-positive (middle) nuclei of mice co-injected with AAV1-FLEX-SaCas9-U6-sgTh (G) and AAV1-FLEX-EGFP-KASH or AAV1-FLEX-SaCas9-U6-sgGt(Rosa26)Sor (H) and AAV1-FLEX-EGFP-KASH into the VTA. Most common indels (bottom) for Th-targeted (G) and Gt(Rosa26)Sor-targeted (H) nuclei.
(I and J) Percentage of sequence reads with wild-type, insertion, deletion, or base changes for Th-targeted (I) and Gt(Rosa26)Sor-targeted (J) nuclei.

