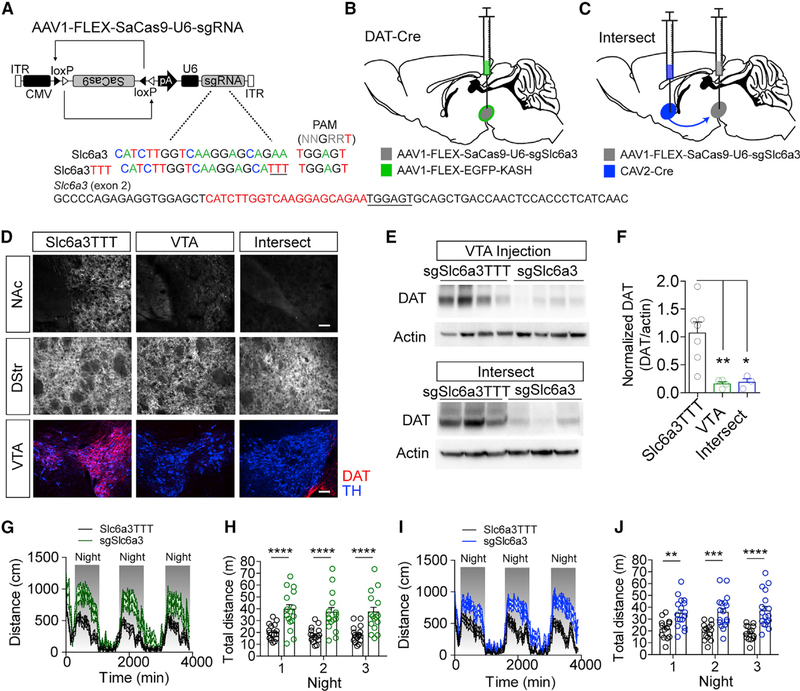
Figure 5. Intersectional Strategy Targeting Slc6a3 Produces Robust DAT Knockout and Hyperactivity.
(A) Design of AAV1-FLEX-SaCas9-U6-sgSlc6a3 and control virus AAV1-FLEX-SaCas9-U6-sgSlc6a3TTT. Exon 2 of Slc6a3 is denoted with guide sequence highlighted in red; the PAM is underlined.
(B) Illustration of viral injections into the VTA.
(C) Illustration of intersectional strategy with injection of CAV2-CMV-Cre into the terminals of VTA dopamine neurons in the nucleus accumbens (NAc) and AAV1-FLEX-SaCas9-U6-sgSlc6a3 into VTA dopamine cell bodies in wild-type mice.
(D) Example IHC images of DAT and TH in the NAc, dorsal striatum (DStr), and VTA in control, VTA-targeted, or intersect-strategy mice. Scale bar: 250 mm.
(E) Western blots from NAc punches probing for DAT and actin comparing the single AAV1-FLEX-SaCas9-U6-sgSlc6a3 VTA injection and the intersect strategy with controls.
(F) Quantification of DAT levels from the western blots (controls, n = 7; VTA sgSlc6a3, n = 4; VTA-NAc sgSlc6a3, n = 3; one-way ANOVA, F[2, 11] = 9.055, p < 0.001; Tukey’s multiple-comparisons test, *p < 0.05 and **p < 0.01).
(G and H) Locomotion measured for AAV1-FLEX-SaCas9-U6-sgSlc6a3 single VTA injection (controls, n = 16; sgSlc6a3, n = 15), across 3 consecutive days and nights in 15 min time bins (G) and comparison of total distance traveled across 3 consecutive nights (H) (two-way repeated-measures ANOVA, effect of genotype, F[1, 29] = 23.66, p < 0.0001; Bonferroni multiple comparisons, ****p < 0.0001).
(I and J) Locomotion measured for the intersectional strategy (controls, n = 14; sgSlc6a3, n = 17), across 3 consecutive days and nights in 15 min time bins (I) and comparison of total distance traveled across three consecutive nights (J) (two-way repeated-measures ANOVA, effect of virus, F[1, 29] = 19.65, p < 0.0001; Bonferroni multiple comparisons, **p < 0.01, ***p < 0.001, and ****p < 0.0001). Data are presented as mean ± SEM.

