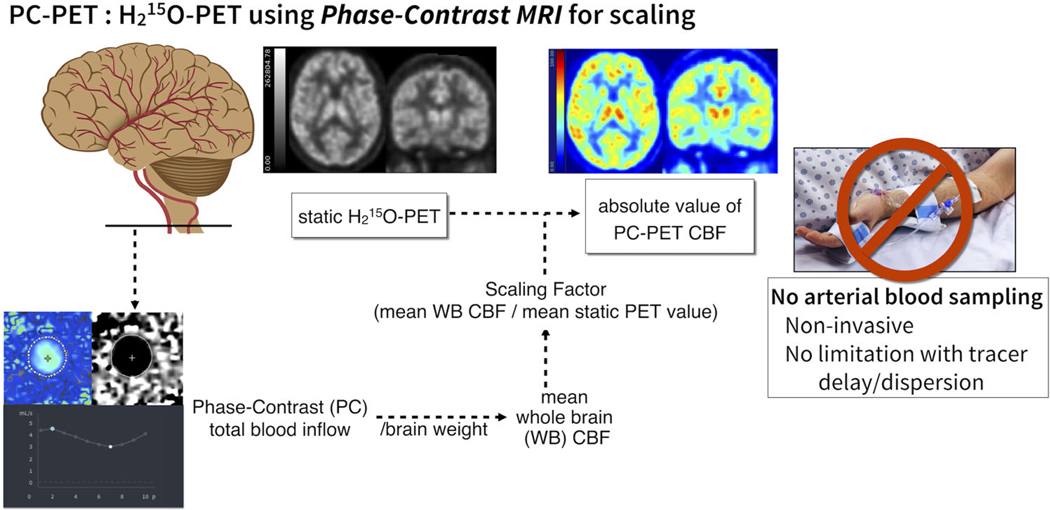
FIGURE 1:
Schematic flow chart of PC PET method. A scan-specific scaling factor is calculated to scale the static O-15 water PET counts (2 min), to be consistent with WB CBF determined from a simultaneous PC scan. The WB CBF is derived from PC total blood inflow is normalized with brain volume estimated from a segmented 3D T1-weighted anatomical MR-scan. The static H215O PET volume is then scaled to the WB CBF value to achieve a quantitative map of CBF in absolute units.

