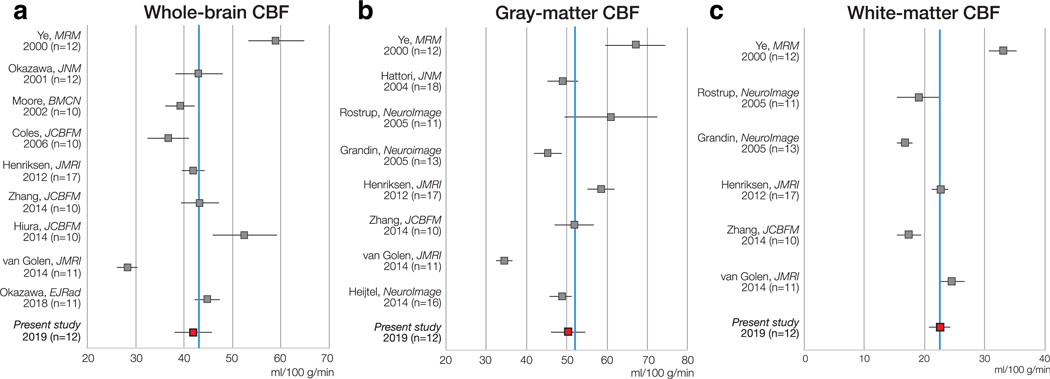
FIGURE 3:
PC-PET CBF in healthy controls compared with literature values derived from H215O-PET across the WB (a), the GM (b), and WM (c). Error bars are estimated 95% confidence intervals that account for the standard deviation and the sample size of each study. The solid blue line represents the mean H215O-PET CBF value across the studies. PC: phase-contrast, PET: positron emission tomography.

