Figure 1.
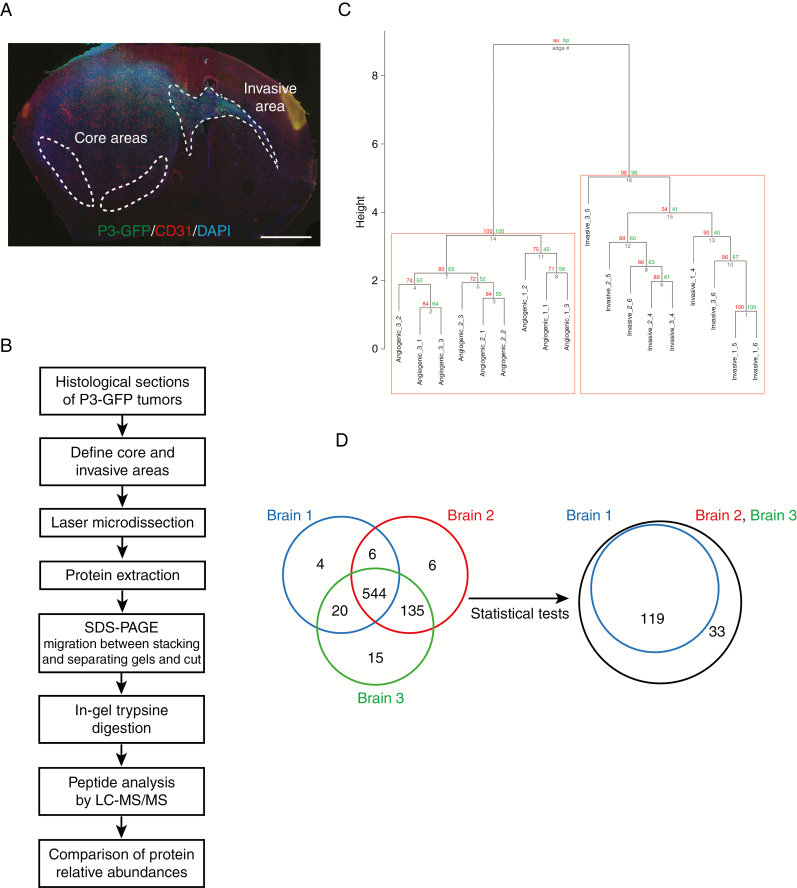
Laser-capture microdissection and proteomics analysis for comparing central and invasive glioblastoma areas. (A) Schematic representation of P3 tumor core and invasive areas. P3-GFP cells were stereotactically injected into mouse hemisphere and were visualized using fluorescence microscopy with CD31 and DAPI staining (P3 in green, CD31 in red, and DAPI in blue). Scale bar = 500 µm. (B) Technical flow chart of P3 tumors analysis by combining laser microdissection and mass spectrometry analysis. (C) Hierarchical clustering of paired samples obtained from the analysis of the log-ratio values of the 544 proteins common for all samples. Values at the left represent approximately unbiased P values (AU) and values at the right correspond to boot- strap probability (BP). (D) Venn diagrams of Human proteins expressed in the three different tumors analyzed by proteomics. 544 proteins are common between the three tumors (left diagram). After Welch test P-values by FDR and setting the significance threshold at 0.01, 152 Human proteins were found differentially regulated between the core and the invasive areas (right diagram).

