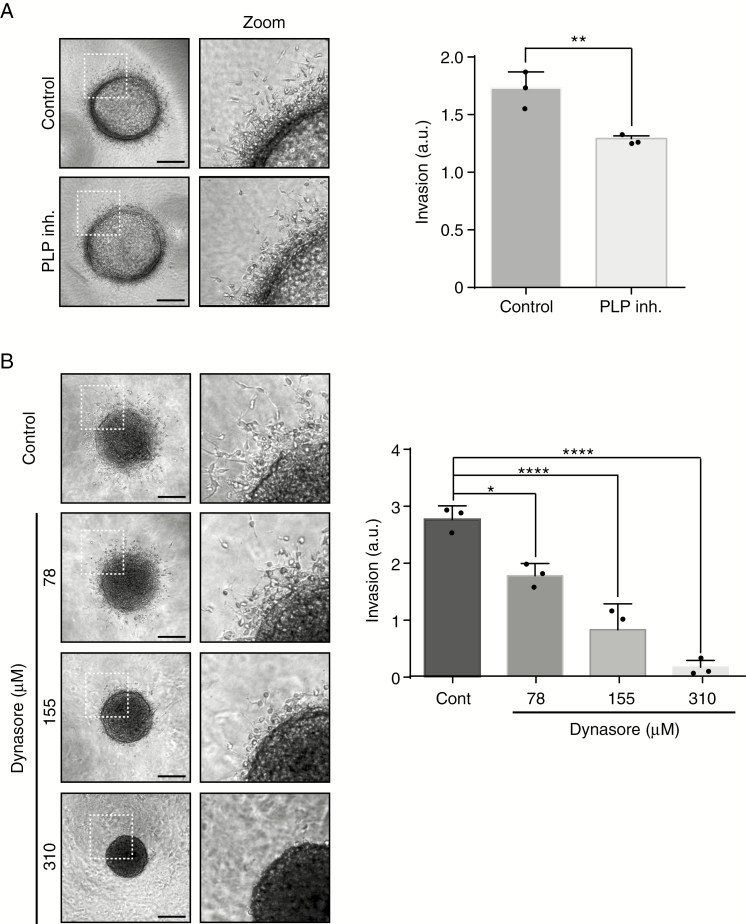
Figure 4.
DNM1 and PLP1 control P3 cell invasion. (A) P3 cells were included into Collagen I gels and then incubated with control or PLP1 inhibitor (80 µg/ml). P3 spheroid invasion was measured in collagen I gels after 24 h. Scale: 50 µm. The graph represents the results as means ± SD of three independent experiments, each done in eight replicates for each condition. **P < .01 (Student t-test). (B) P3 cells were included into Collagen I gels and then incubated with control or DNM1 inhibitor Dynasore at several concentrations (78, 155, or 310 µM). P3 spheroid invasion was measured in collagen I gels after 24 h. Scale: 50 µm. The graph represents the results as means ± SD of three independent experiments, each done in eight replicates for each condition. *P < .05; ****P < .0001 (ANOVA).

