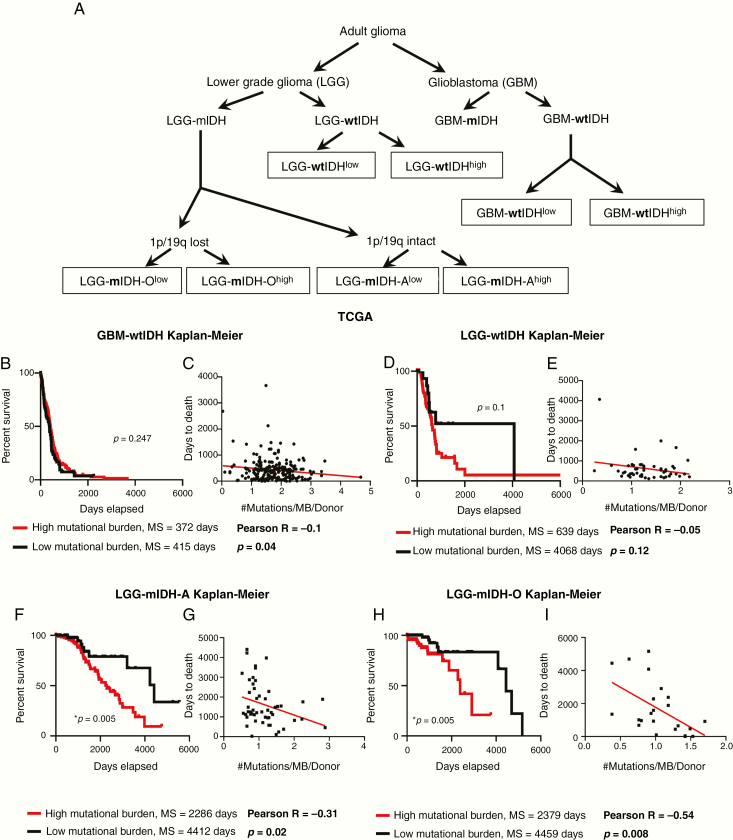
Figure 1.
Poor prognosis in mIDH patients from TCGA with a high mutational burden. (A) Classification of glioma patients according to the subtype and mutational burden used in this study. (B) Kaplan–Meier survival of GBM-wtIDH patients with high mutational burden (red; N = 71) or low mutational burden (black; N = 208) from TCGA. There was no significant difference in survival between groups (hazard ratio [HR] = 1.203, CI [1.644–0.87]). (C) Linear regression model of patients’ “days to death” versus mutational burden/patient in GBM-wtIDH (N = 218). There was no correlation between patients’ “days to death” and mutational load. (D) Kaplan–Meier curves of LGG-wtIDH patients classified according to the mutational burden in TCGA. There is no difference in survival between LGG-wtIDHhigh (N = 72) and LGG-wtIDHlow (N = 22) (HR = 0.58, CI [0.29–1.125]). (E) Linear regression model of patients’ “days to death” versus mutation burden/patient in LGG-wtIDH (N = 51). There was no correlation between patients’ “days to death” and mutational load. (F) LGG-mIDH-Ahigh (N = 189) has statistically significant decreased median survival as compared to LGG-mIDHlow (N = 63) (HR = 0.3891, CI [0.2193–0.6905]). (G) Linear regression model of patients’ “days to death” versus mutation burden/patient in LGG-mIDH-A (N = 51). There is a significant correlation between patients’ days to death and mutation load/patient in LGG-mIDH-A (R = −0.31, P < .001). (H) LGG-mIDH-Ohigh (N = 74) has statistically significantly decreased median survival as compared to LGG-mIDHlow (N = 95) (HR = 0.3198, CI [0.1343–0.7616]). (I) Linear regression model of patients’ “days to death” versus mutation burden/patient in LGG-mIDH-O (N = 23). There is a significant correlation between patients’ days to death and mutation load/patient in LGG-mIDH-O (R = −0.54, P < .001).

