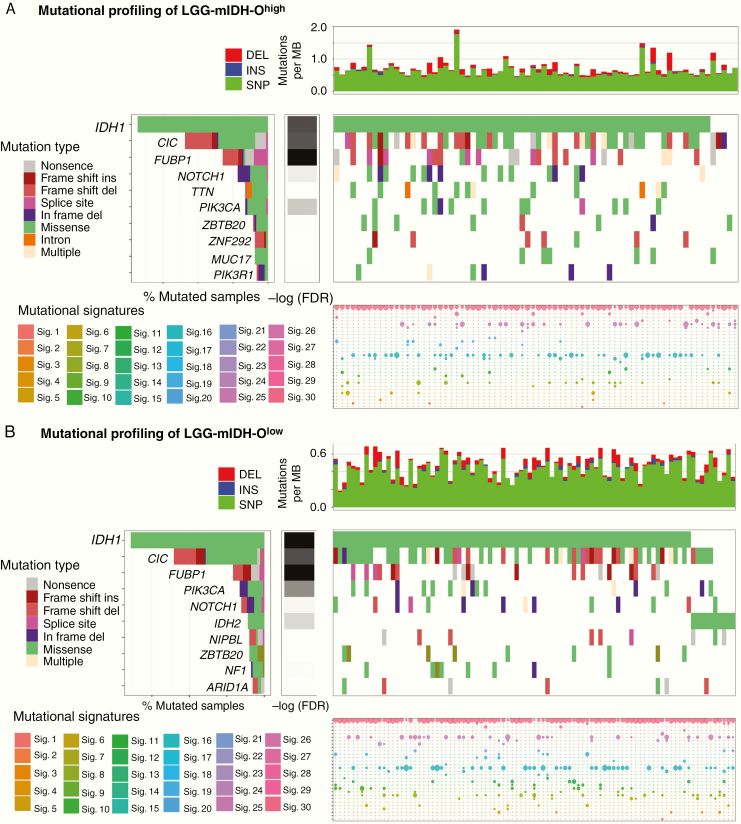
Figure 3.
Somatic genetic alterations identified in LGG-mIDH-O according to the tumor mutational burden. (A) Upper plot shows the mutation rate for each tumor sample in LGG-mIDH-Ohigh. Middle plot: Heatmap of the most frequent somatic mutations identified in LGG-mIDH-Ohigh. Genes are sorted according to the FDR q-value. Lower plot: Mutational signature analysis in LGG-mIDH-Ohigh samples. (B) Upper plot shows the mutation rate for each tumor sample in LGG-mIDH-Olow. Middle plot: Heatmap of the most frequent somatic mutations identified in LGG-mIDH-Olow. Genes are sorted according to the FDR q-value. Lower plot: Mutational signature analysis in LGG-mIDH-Olow samples. Color codes represent the mutation type or mutation signature as indicated in the left panel.

