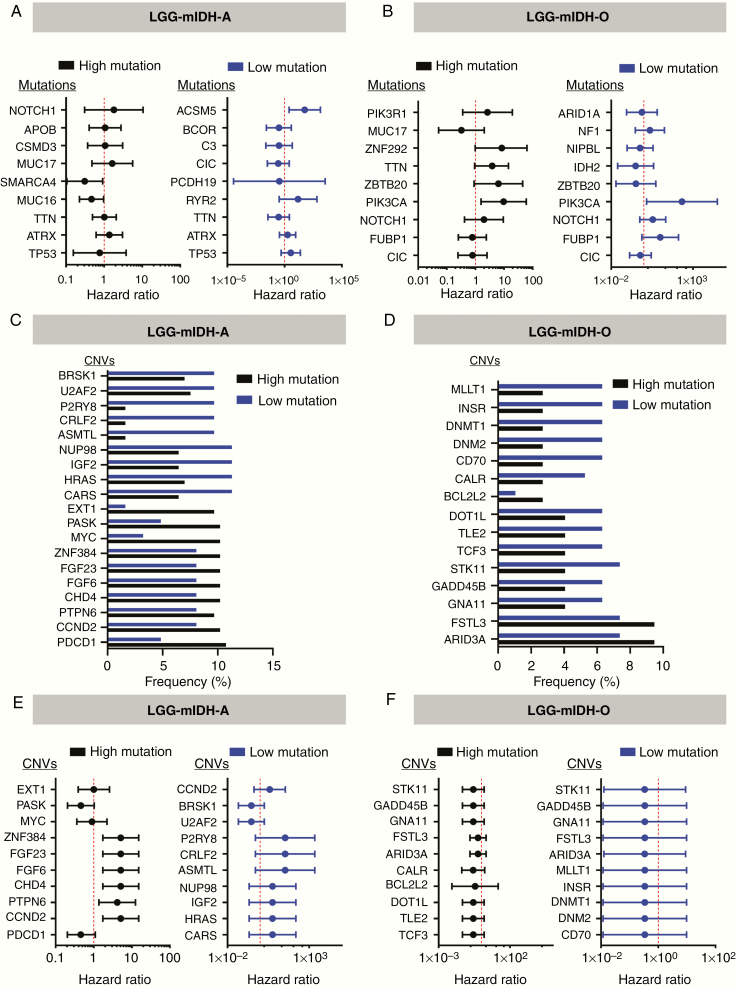
Figure 4.
CNVs frequency and hazard ratios (HRs) for OS in the Cox regression model in LGG-mIDH-A and LGG-mIDH-O. (A) HRs for OS in the Cox regression model according to the presence or absence of the frequently mutated genes among the LGG-mIDH-A. (B) HRs for OS in the Cox regression model according to the presence or absence of the frequently mutated genes among the LGG-mIDH-O. (C and D) The most frequent CNVs in high versus low mutation in LGG-mIDH-A and LGG-mIDH-O, respectively. (E and F) HRs for OS in the Cox regression model according to the presence or absence of the most frequent CNVs among the groups.

