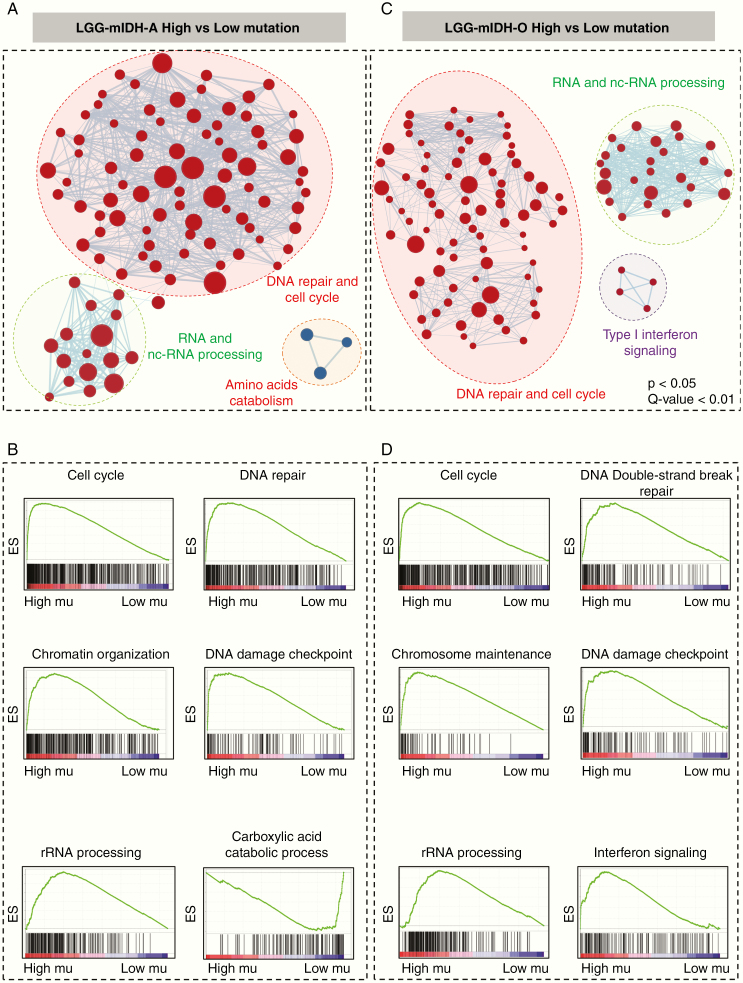
Figure 5.
Gene set enrichment analysis (GSEA) of high versus low mutation load in LGG-mIDH-A and LGG-mIDH-O. (A and C) Cytoscape map visualization of the positive (red) and negative (blue) enriched GO groups in high versus low mutation load in LGG-mIDH-A (LGG-mIDH-AhighN = 189, LGG-mIDH-AlowN = 63) (A) and LGG-mIDH-O (LGG-mIDH-OhighN = 74, LGG-mIDH-OlowN = 95) (C). (B and D) Enrichment plots of the top significantly altered GO in the high versus low mutation load in LGG-mIDH-A and LGG-mIDH-O.

