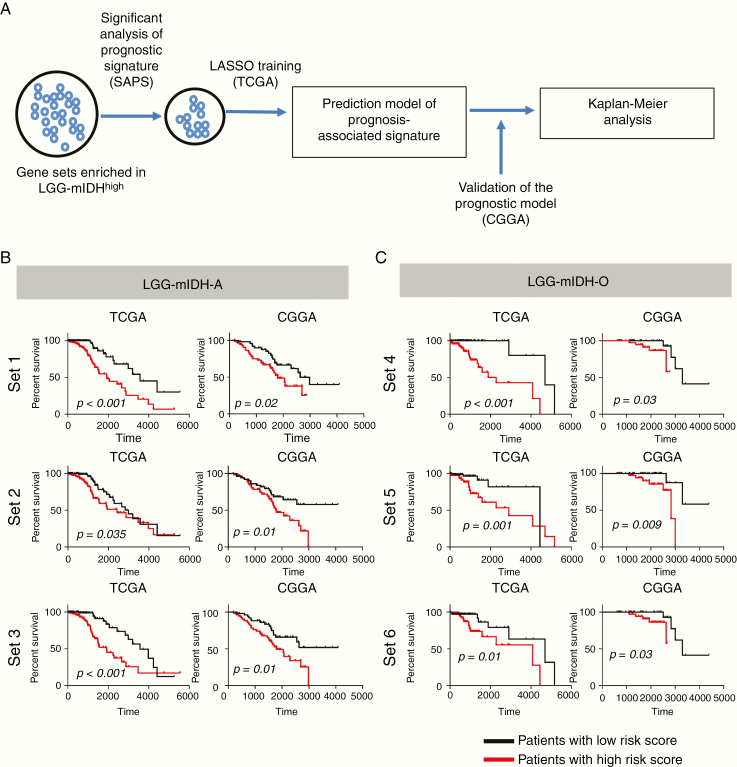
Figure 6.
Kaplan–Meier survival analysis of LGG-mIDH patients with high-risk versus a low-risk score of each gene set. (A) Flow chart illustrating the construction of the high-risk gene set in LGG-mIDH-A and LGG-mIDH-O. Significant gene sets in LGG-mIDH were selected based on GSEA. SAPS analysis was done to test the significant prognostic gene sets. Finally, LASSO was performed to predict the genes that mostly impact survival. (B) Kaplan–Meier analysis of patients with high-risk versus a low-risk score based on the 3 genes sets that predict survival in LGG-mIDH-A of TCGA (training) and CGGA (validation) datasets. (C) Kaplan–Meier analysis of patients with high-risk versus low-risk score based on the 3 genes sets that predict survival in LGG-mIDH-O of TCGA (training) and CGGA (validation) dataset (TCGA: LGG-mIDH-A [N = 245], TCGA: LGG-mIDH-O [N = 149], CGGA: LGG-mIDH-A [N = 108], CGGA: LGG-mIDH-O [N = 80]).

