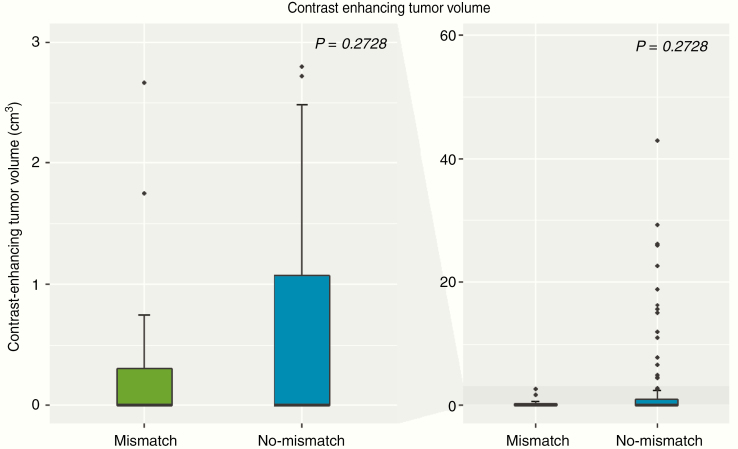
Figure 3.
Boxplot of contrast-enhancing tumor volumes (cm3) comparing patients with IDH-mutant gliomas who present the T2/FLAIR-mismatch sign (green color) and who did not (blue color). The left side of the figure zooms to the range of 0–3 cm3, whereas the right side shows the full range of data (0–60 cm3). There was no significant difference in contrast-enhancing tumor volumes between patients who present the T2/FLAIR-mismatch sign and patients who did not (P = .2728).

