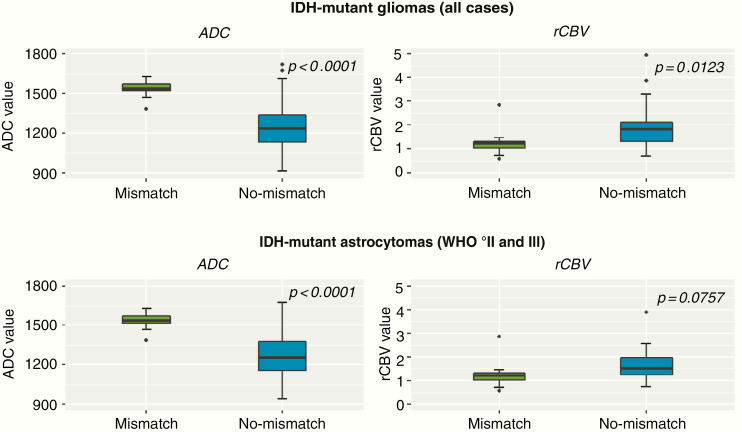
Figure 4.
Boxplot of mean ADC and rCBV values comparing patients with IDH-mutant gliomas who present the T2/FLAIR-mismatch sign (green color) and those who did not (blue color). Analysis of all IDH-mutant gliomas (ie, including astrocytoma, oligodendroglioma, and glioblastoma cases—top row) and separate analysis for the subset of patients with IDH-mutant astrocytomas (bottom row) were performed. The median ADC values were significantly higher in both IDH-mutant gliomas (P < .0001) and in the subset of IDH-mutant astrocytomas (P < .0001) without the T2/FLAIR-mismatch sign as compared those with a T2/FLAIR-mismatch sign (left column). The median rBCV values were significantly lower in IDH-mutant gliomas (P = .0123) with the presence of a T2/FLAIR-mismatch sign, whereas only borderline significance was found within the subset of IDH-mutant astrocytomas (P = .0757) (right column).

