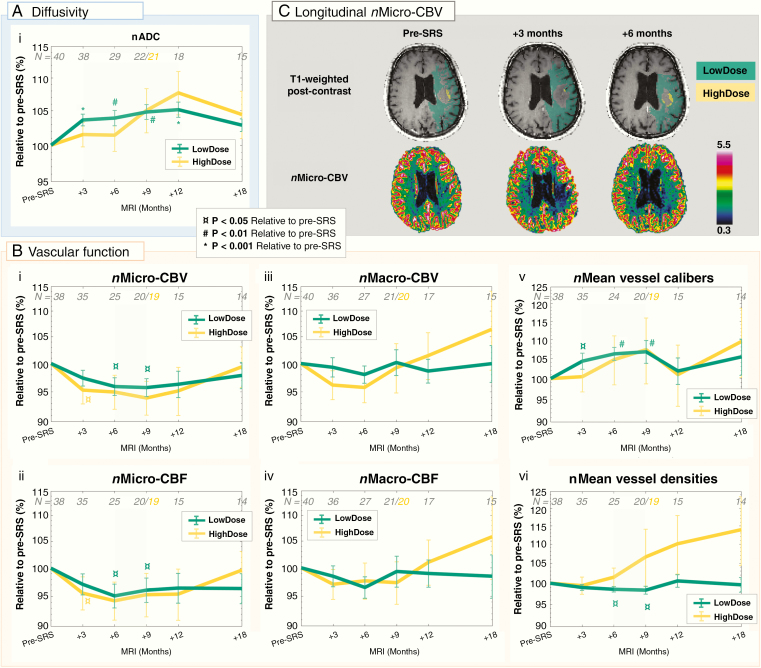
Figure 3.
Increased diffusivity and decreased vascular function in normal-appearing brain up until 18 months post-SRS. Mean ± SEM of normalized (n) metrics relative to pre-SRS (%) in normal-appearing brain tissue in LowDose (green) and HighDose (yellow) on a logarithmic scale: (Ai) the apparent diffusion coefficient (nADC), (Bi) nMicro-vascular blood volume (CBV), (Bii) nMicro-vascular blood flow (CBF), (Biii) nMacro-CBV, (Biv) nMacro-CBF, (Bv) nMean vessel calibers, and (Bvi) nMean vessel densities. Transient changes in diffusivity and vascular function are highlighted by shaded green areas. The number of patients (N) included at each time point is shown in gray. At 9 months post-SRS, analysis of the HighDose region was excluded for one patient due to insufficient number of voxels in this region (total number of patients analyzed is shown in yellow). (C) Reduced nMicro-CBV in LowDose at 3 and 6 months post-SRS compared to pre-SRS is shown for a patient with a brain metastasis from malignant melanoma (bottom row), with corresponding T1-weighted post-contrast images indicating LowDose (green) and HighDose (yellow) regions (top row). P values from the Wilcoxon Singed-Rank test relative to pre-SRS.

