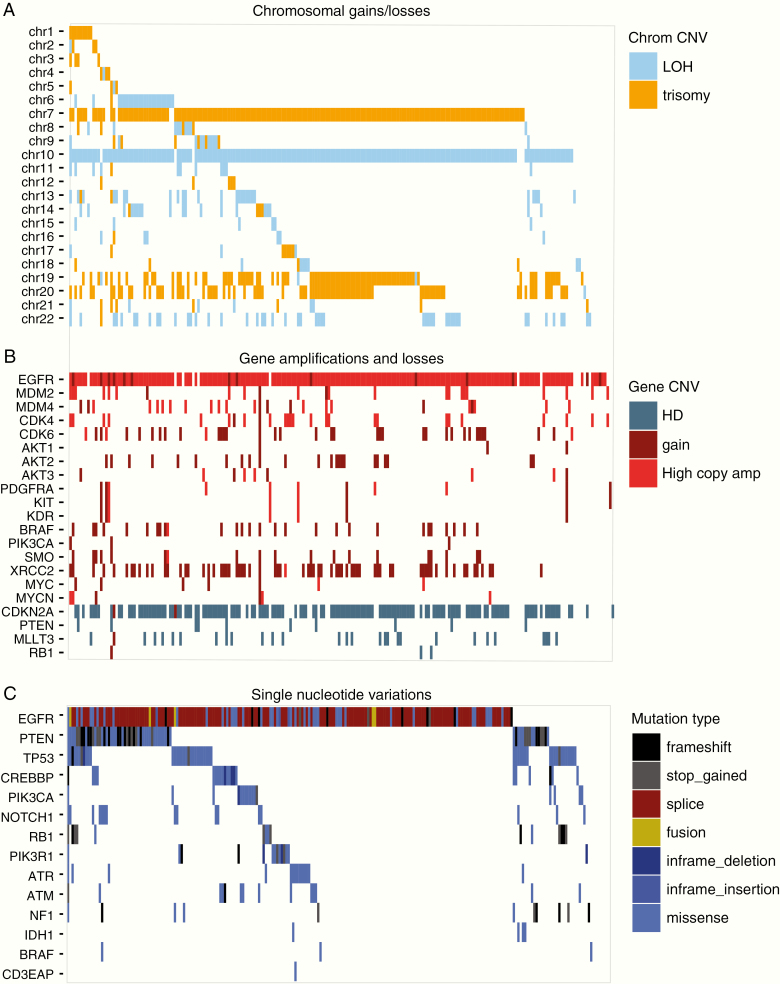
Figure 1.
Genomic landscape of samples included in the INTELLANCE-2/EORTC_1410 trial. Shown are waterfall plots of chromosomal changes (A), gains and losses of individual genes (B), and SNVs within individual genes (C). The copy number changes, gene amplifications/deletions, and mutations are similar to observed in other (EGFR-amplified) glioblastoma datasets. Patients included in this study therefore were not selected for a specific molecularly subtype. LOH = loss of heterozygosity; HD = homozygous deletion.

