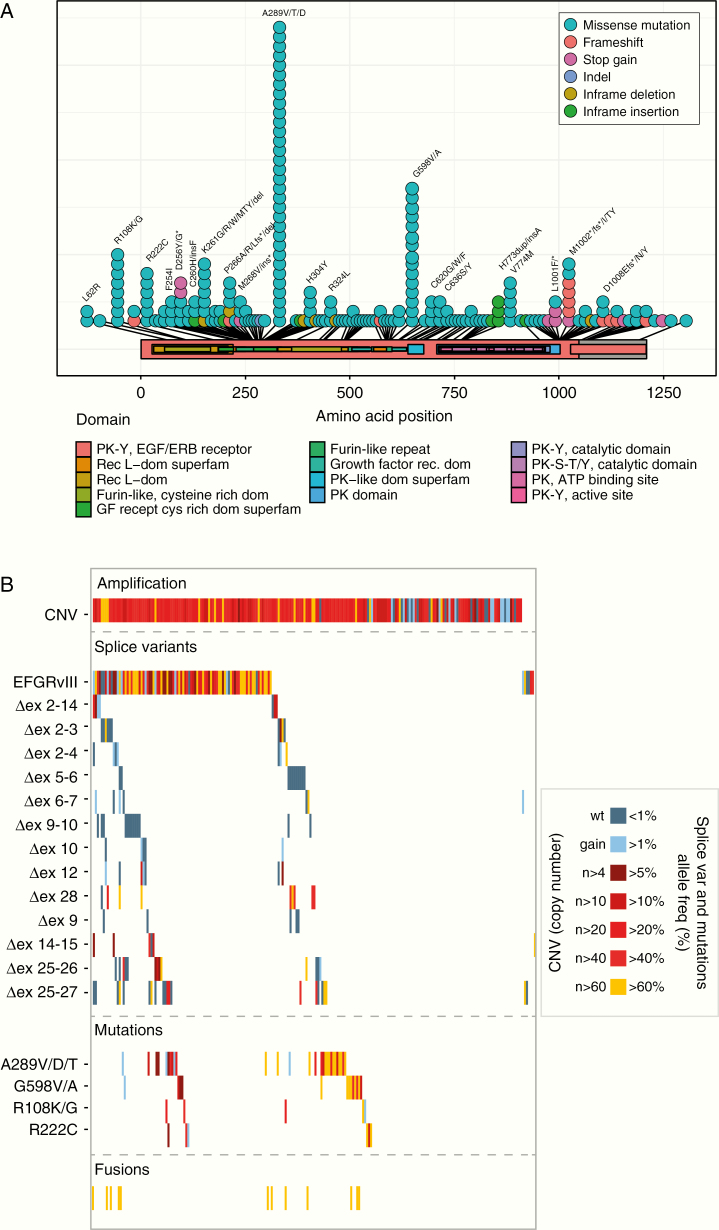
Figure 2.
Genetic changes within the EGFR gene of samples from patients included in the INTELLANCE-2/EORTC_1410 trial. (A) Lolliplot of SNVs identified showing characteristic hotspot mutations in the extracellular domain. (B) Waterfall plots of genetic changes subdivided in copy number gains, splice variant expression, and mutations. The waterfall plot is color coded to represent the level of copy number gain (in the CNV plot) or the percentage of mutant alleles (percentage spliced in).

