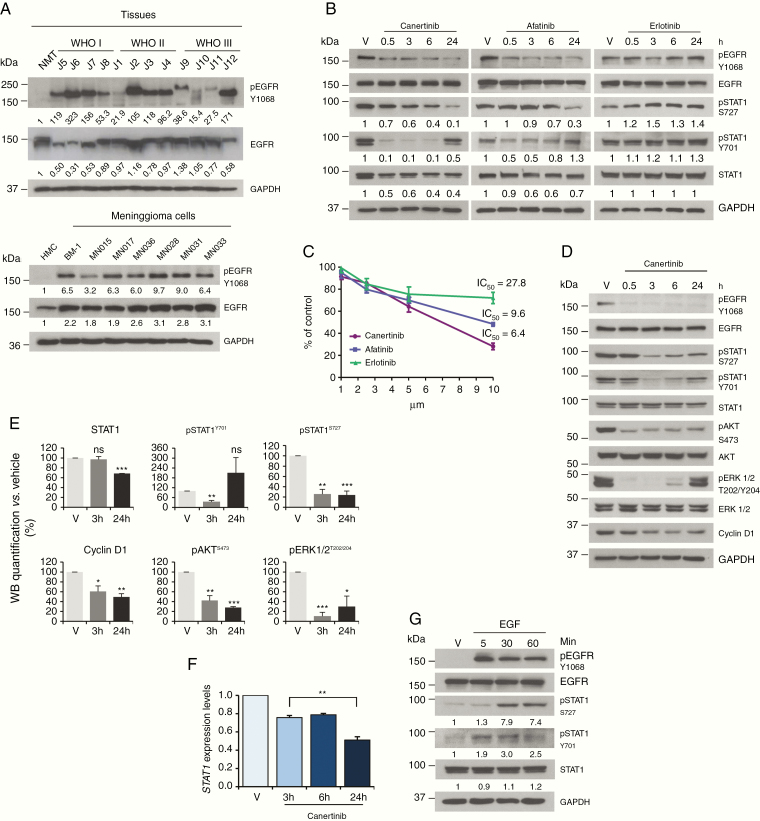
Figure 5.
The constitutive activation of the EGFR in meningioma induces STAT1 phosphorylation. (A) Representative WB analysis of total and pEGFR-Y1068 in meningioma, when compared to control. Upper panel: WHO I, II, and III meningioma tissues compared to NMT; lower panel: BM-1 and primary MN cells compared to HMC. (B) WB of STAT1 and pSTAT1 protein levels after treatment with 5 μM of canertinib, afatinib, and erlotinib in BM-1 cells. The reduced levels of pEGFR-Y1068 confirmed drug activity. (C) ATP-proliferation assay performed in BM-1 cells after treatment with different concentrations of canertinib, afatinib, and erlotinib for 24 h. (D) WB analysis of STAT1, pSTAT1, and other markers of proliferation in primary MN cells after treatment with 10 μM of canertinib. (E) Histograms representing WB quantification at 3 and 24 h for STAT1, pSTAT1, pAKT, pERK1/2, and cyclin D1 after canertinib treatment in 3 different primary MN cells (see Supplementary Figure S4). Data are presented as mean ± SEM, *P < .05, **P < .01, ***P < .001. (F) qPCR analysis showing the statistical reduction of STAT1 gene expression at 3, 6, and 24 h after treatment with 10 μM of canertinib (n = 3). Data are presented as mean ± SEM; **P < .01. (G) WB representing STAT1 and pSTAT1 in BM-1 cells, following treatment with EGF (50 ng/ml) for 5, 30, and 60 min.

