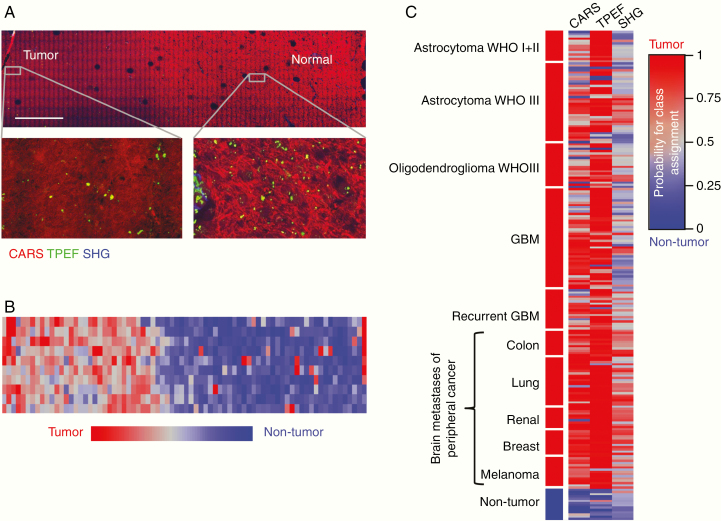
Figure 1.
Classification of brain tumors versus nontumor brain tissue based on CARS, TPEF, or SHG. (A) CARS/TPEF/SHG image of the tumor border of an anaplastic astrocytoma WHO III, scale bar 1 mm. (B) False-color image of the probability of class assignment based on texture analysis of CARS images for the sample shown in A. (C) Probability of class assignment plotted for each patient of the test set using a color code ranging from red (tumor) to blue (nontumor) for the CARS, TPEF, and SHG images, respectively. Each line represents 1 patient. Linear discriminant analysis of texture parameters of brain tumors (n = 204) versus nontumor brain tissue (n = 14) was performed using an independent training set.

