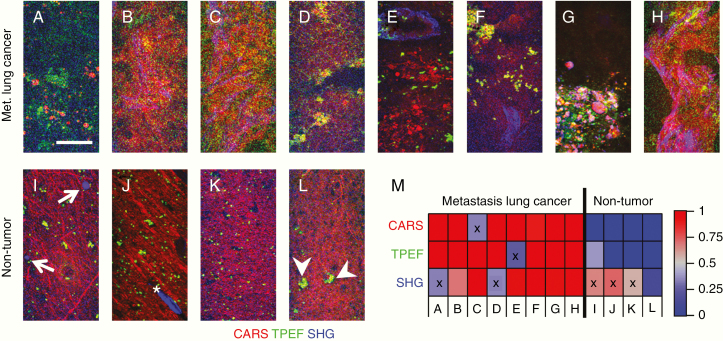
Figure 2.
Micromorphology of human metastases of lung cancer and nontumor tissue. (A–H) CARS/TPEF/SHG images of metastases of lung cancer. (I–L) CARS/TPEF/SHG images of nontumor brain tissue. The intensity of channels was normalized (min–max), arrows indicate corpora amylacea, asterisk indicates a blood vessel, arrow heads indicate cells with fluorescent inclusions, scale bar: 50 µm. (M) Classification result of the images shown in A–I for each channel. The color code shows the probability of class assignment for being nontumor (blue) and metastasis of lung cancer (red); “x” indicates misclassification.

