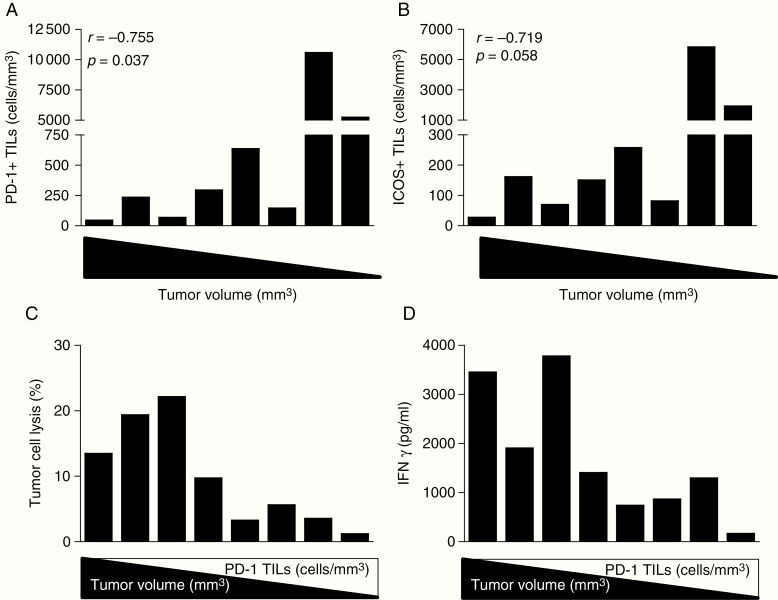
Fig. 2.
High density of intratumoral PD-1+ T cells after Delta24-RGD therapy inversely correlates with brain tumor size and ex vivo T cell activity. Expression of PD-1+ and ICOS+ TILs analyzed by flow cytometry are defined as numbers of positive CD3+ T cells per mm3 tumor volume and stratified by matched tumor volume (from large to small). (A) Large tumor volume was correlated with a low density of PD-1+ TILs (Spearman r = −0.755; P = .037). (B) The density of ICOS+ TILs was not significantly correlated with tumor volume (Spearman r = −0.719; P = .058). (C) Ex vivo cell cultures were established by dissociating brain tumors into single cells which were cultured in a live monitoring incubator for 5 days. The rate of tumor cell lysis was calculated using ImageJ software by comparing the images from day 0 to day 5 of the culture. Tumor cell lysis per TILs culture was correlated with the volume of the brain tumor from which the cultures were derived (Spearman r = 0.802; P = .022) and inversely correlated with the density of PD-1+ TILs (Spearman r = −0.762; P = .037). (D) IFNγ production in supernatant was significantly correlated with brain tumor volume (Spearman r = 0.802; P = .022) and inversely correlated with the density of PD-1+ TILs (Spearman r = −0.714; P = .058).

