Figure 3.
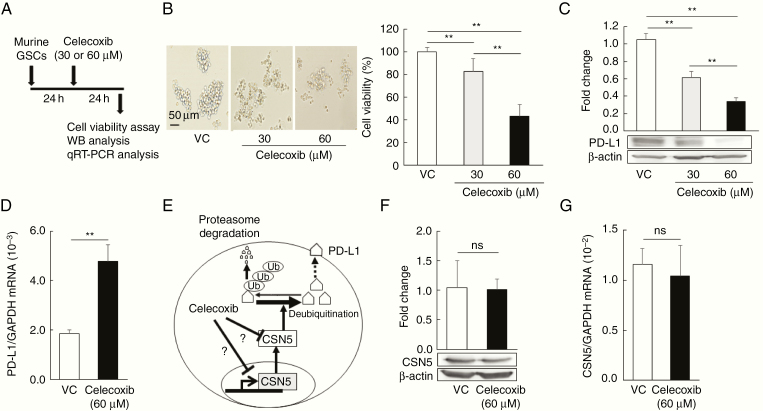
Celecoxib decreases PD-L1 protein expression, but not PD-L1 mRNA expression. (A) Timing of cell-viability, western blotting, and qRT–PCR analyses. (B, C) Cell viability (B, n = 8) and PD-L1 expression (C, n = 3) in murine glioma stem cells (GSCs) treated with 30 or 60 µM celecoxib for 24 hours (mean ± SD). **P < .01, in relation to the other groups, ANOVA followed by the Dunnett test. Scale bar = 50 µm. (D) PD-L1 mRNA levels as assessed by qRT-PCR (mean ± SD, n = 6). **P < .01 vs. the vehicle control (VC) based on a Student’s t-test. (E) Schematic of regulation of PD-L1 expression by CSN5. Ub; ubiquitin. (F, G) CSN5 expression (F, n = 3) and CSN5 mRNA (G, n = 6) levels in murine GSCs treated with 60 µM celecoxib. Each column of data indicates mean ± SD, ns; not significant, Student’s t-test.

