Figure 5.
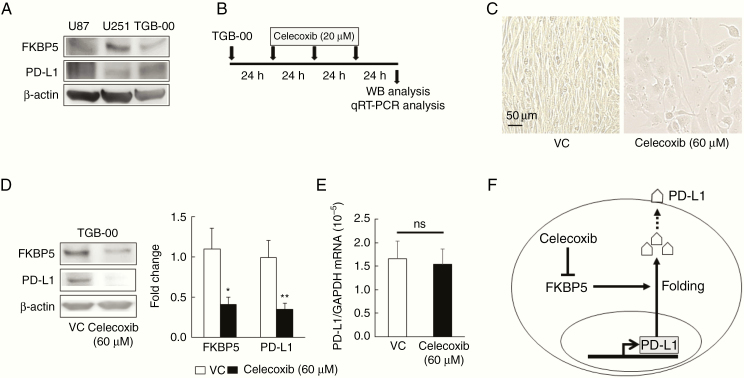
PD-L1 downregulation by celecoxib is associated with the downregulation of FKBP5 in primary glioblastoma (GBM) cells. (A) Representative baseline expression of FKBP5 and PD-L1 in the human GBM cell lines U87 and U251 and in primary cultures of human GBM cells, TGB-00. Western blot (WB) analysis was repeated three times. (B–E) WB and qRT–PCR analysis of TGB-00 cells treated three times with 20 µM celecoxib or vehicle for 24 hours (B). Representative images of TGB-00 cells (C), protein expression (D, n = 3), and the mRNA levels (E, n = 6) of FKBP5 and PD-L1 in TGB-00 cells. Each data point indicates mean ± SD, *P < .05, **P < .01 vs. vehicle (VC) based on a Student’s t-test. ns; not significant. Scale bar = 50 µm. (F) Schematic of the regulation of PD-L1 expression via the inhibition of FKBP5 mediated by celecoxib.

