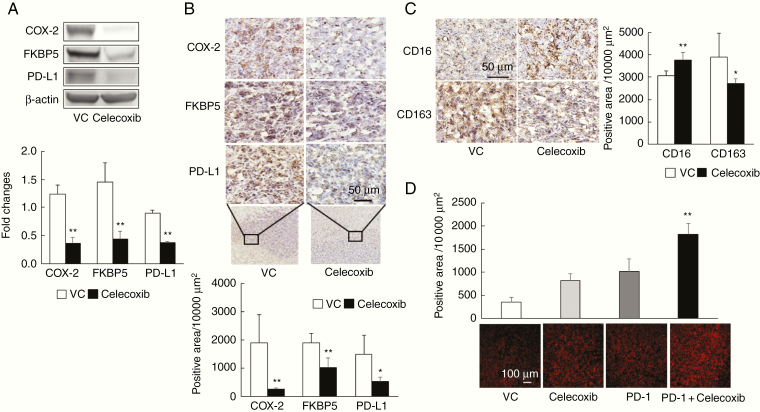
Figure 6.
Celecoxib-mediated downregulation of PD-L1 via FKBP5 in a murine malignant glioma model. (A) Expression of COX-2, FKBP5, and PD-L1 protein, as measured by western blot analysis in a murine malignant glioma model (vehicle control [VC] and monotherapy with celecoxib group). Brain tissue samples were analyzed on day 14 as in Figure 2A. Each experiment was repeated three times (mean ± SD). **P < .01 vs. VC based on a Student’s t-test. (B) Immunohistochemistry for COX-2, FKBP5, and PD-L1; positive cells were analyzed by KEYENCE BZ-X710 equipped image analysis (mean ± SD, n = 5). Scale bar = 50 µm. *P < .05, **P < .01 vs. VC based on a Student’s t-test. (C) Expression of CD16 and CD163 in brain tumor tissues from murine malignant glioma model (mean ± SD, n = 5). Scale bar = 50 µm. *P < .05, **P < .01 vs. VC based on a Student’s t-test. (D) Immunohistochemical staining for PD-1 in brain tumor tissues from murine malignant glioma model. Scale bar = 100 µm. **P < .01 relative to the other groups, based on ANOVA followed by a Tukey test.

