Figure 1.
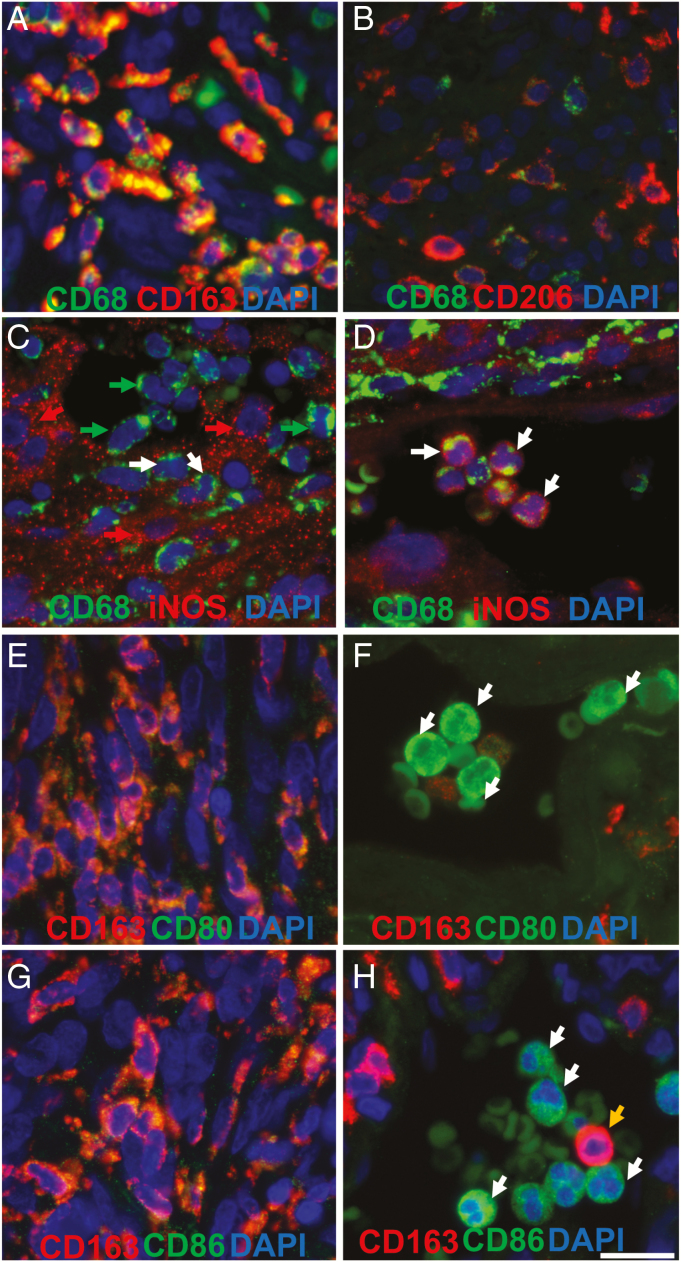
Representative CD68, CD163, CD206, iNOS, CD80, and CD86 staining in meningioma tissue sections. (A) CD68 (green), CD163 (red) tissue section double staining. CD68+/CD163+ cells are characterized as M2 tumor-associated macrophages (TAMs) (B) CD68 (green), CD206 (red) tissue section double staining. (C) CD68 (green), iNOS (red) tissue section double staining. Red and white arrows depict CD68–/iNOS+ tumor cells and CD68+/iNOS+ M1 cells respectively. CD68+/iNOS– M2 cells are labeled by green arrows. (D) Example CD68+/iNOS+ monocytes are labeled by white arrows. CD68+/iNOS– perivascular M2 cells are also present. (E and F) CD80 (green), CD163 (red) tissue section double staining. White arrows in F depict CD80+ monocytes. (G and H) CD86 (green), CD163 (red) tissue section double staining. White arrows in H depict CD86+ monocytes and a CD163+ monocyte is labeled by an orange arrow. Scale bars represent 15 µm.

