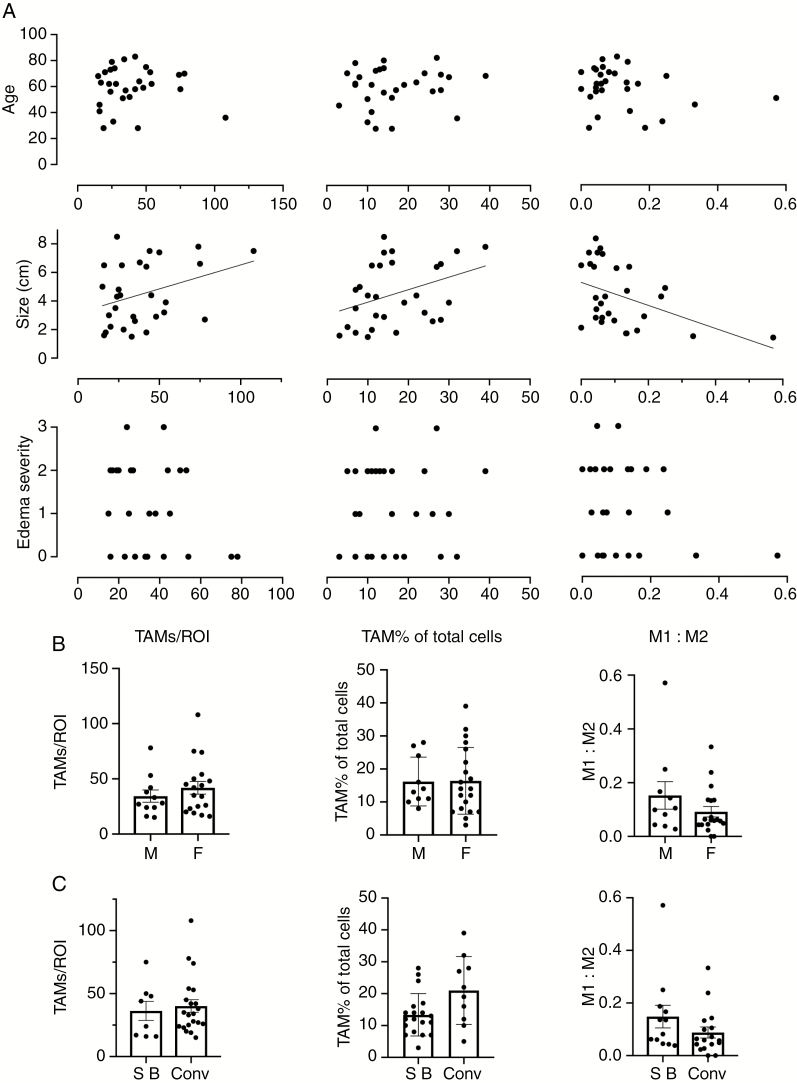
Figure 3.
Association of total tumor-associated macrophages (TAM) number, TAM percentage of total cells and M1/M2 profiles to patient demographics and clinical variables. (A) Scatter plots for patient age, tumor size, and peri-tumoral edema severity according to TAM profile variables. Peri-tumoral edema severity in A; (0 = nil, 1 = mild, 2 = moderate, 3 = severe). (B and C) TAM profile variables according to sex (M—male, F—female) and tumor location (SB—skull base, Conv—convexity) are quantified in bar graphs. Bars represent mean. Error bars in each graph represent ± SEM.

