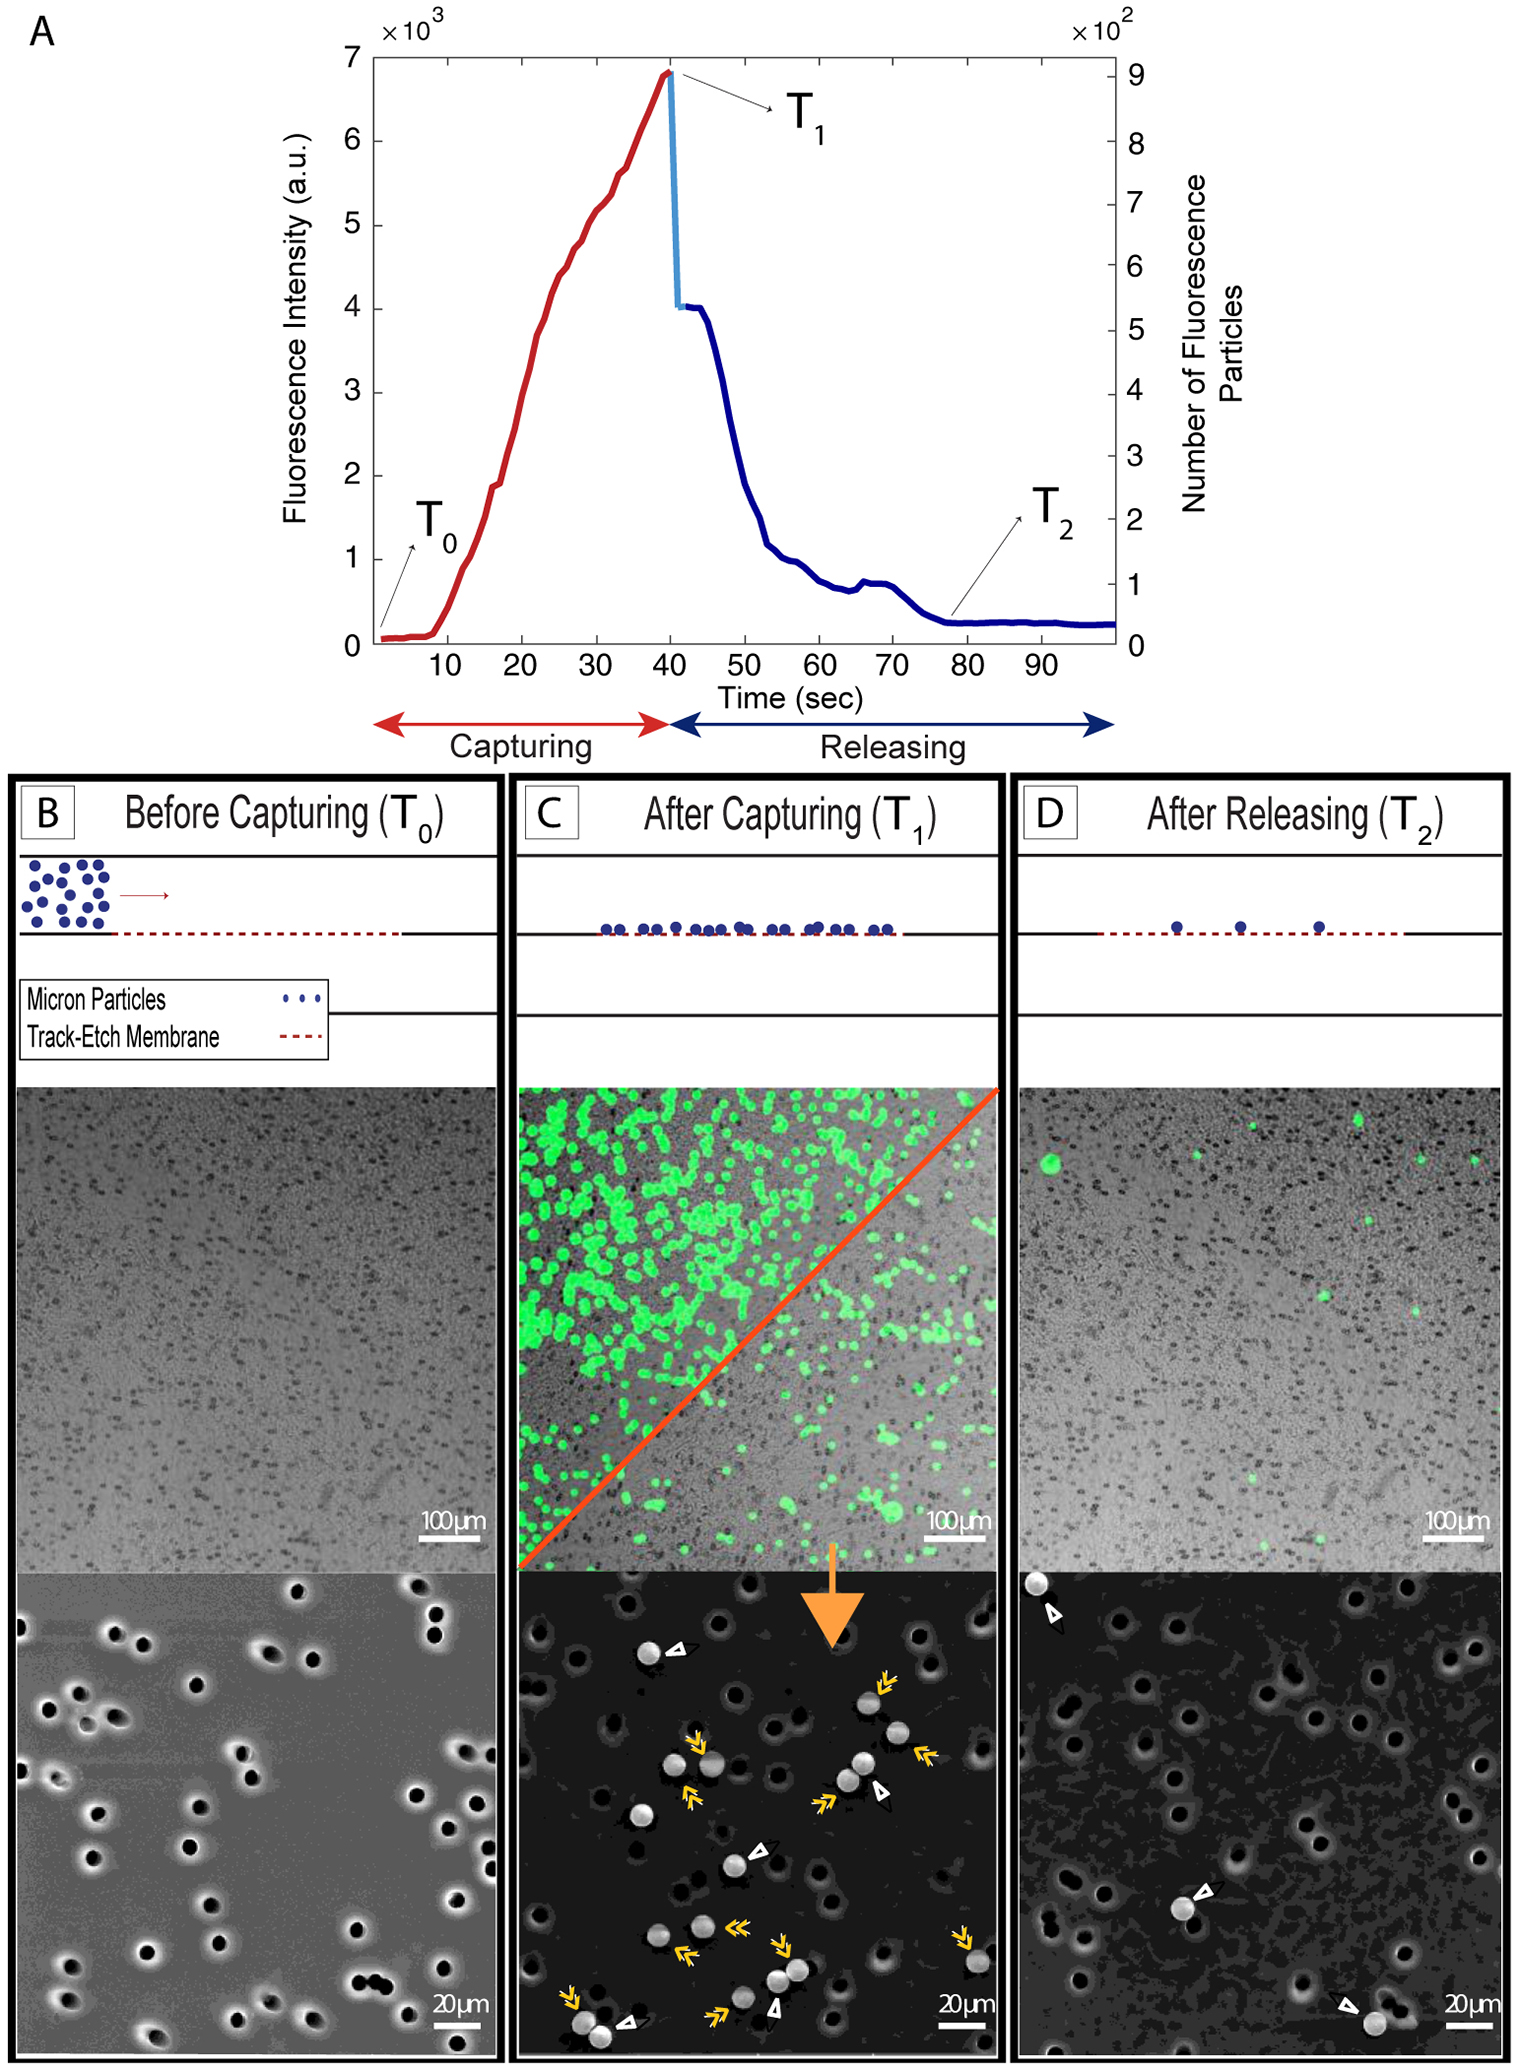
Figure 3: Microscale experiments with 10 μm fluorescent particles and 8 μm pore size polycarbonate track-etch (mPCTE) membranes.

A) Fluorescence intensity/number of particles - time plot showing an increase in the intensity signal/number of particles during the capturing step and a decrease for releasing step. B,C and D) Before capturing, after capturing and after releasing panels, respectively, including schematic images (top), fluorescent images (middle) and scanning electron microscopy images (bottom). The red diagonal in fluorescent panel C shows releasing of captured particles by pausing the pump to change the flow configuration. Particles in panel C are labeled with either single or double arrowheads, indicating non-specifically bound and captured particles, respectively.
