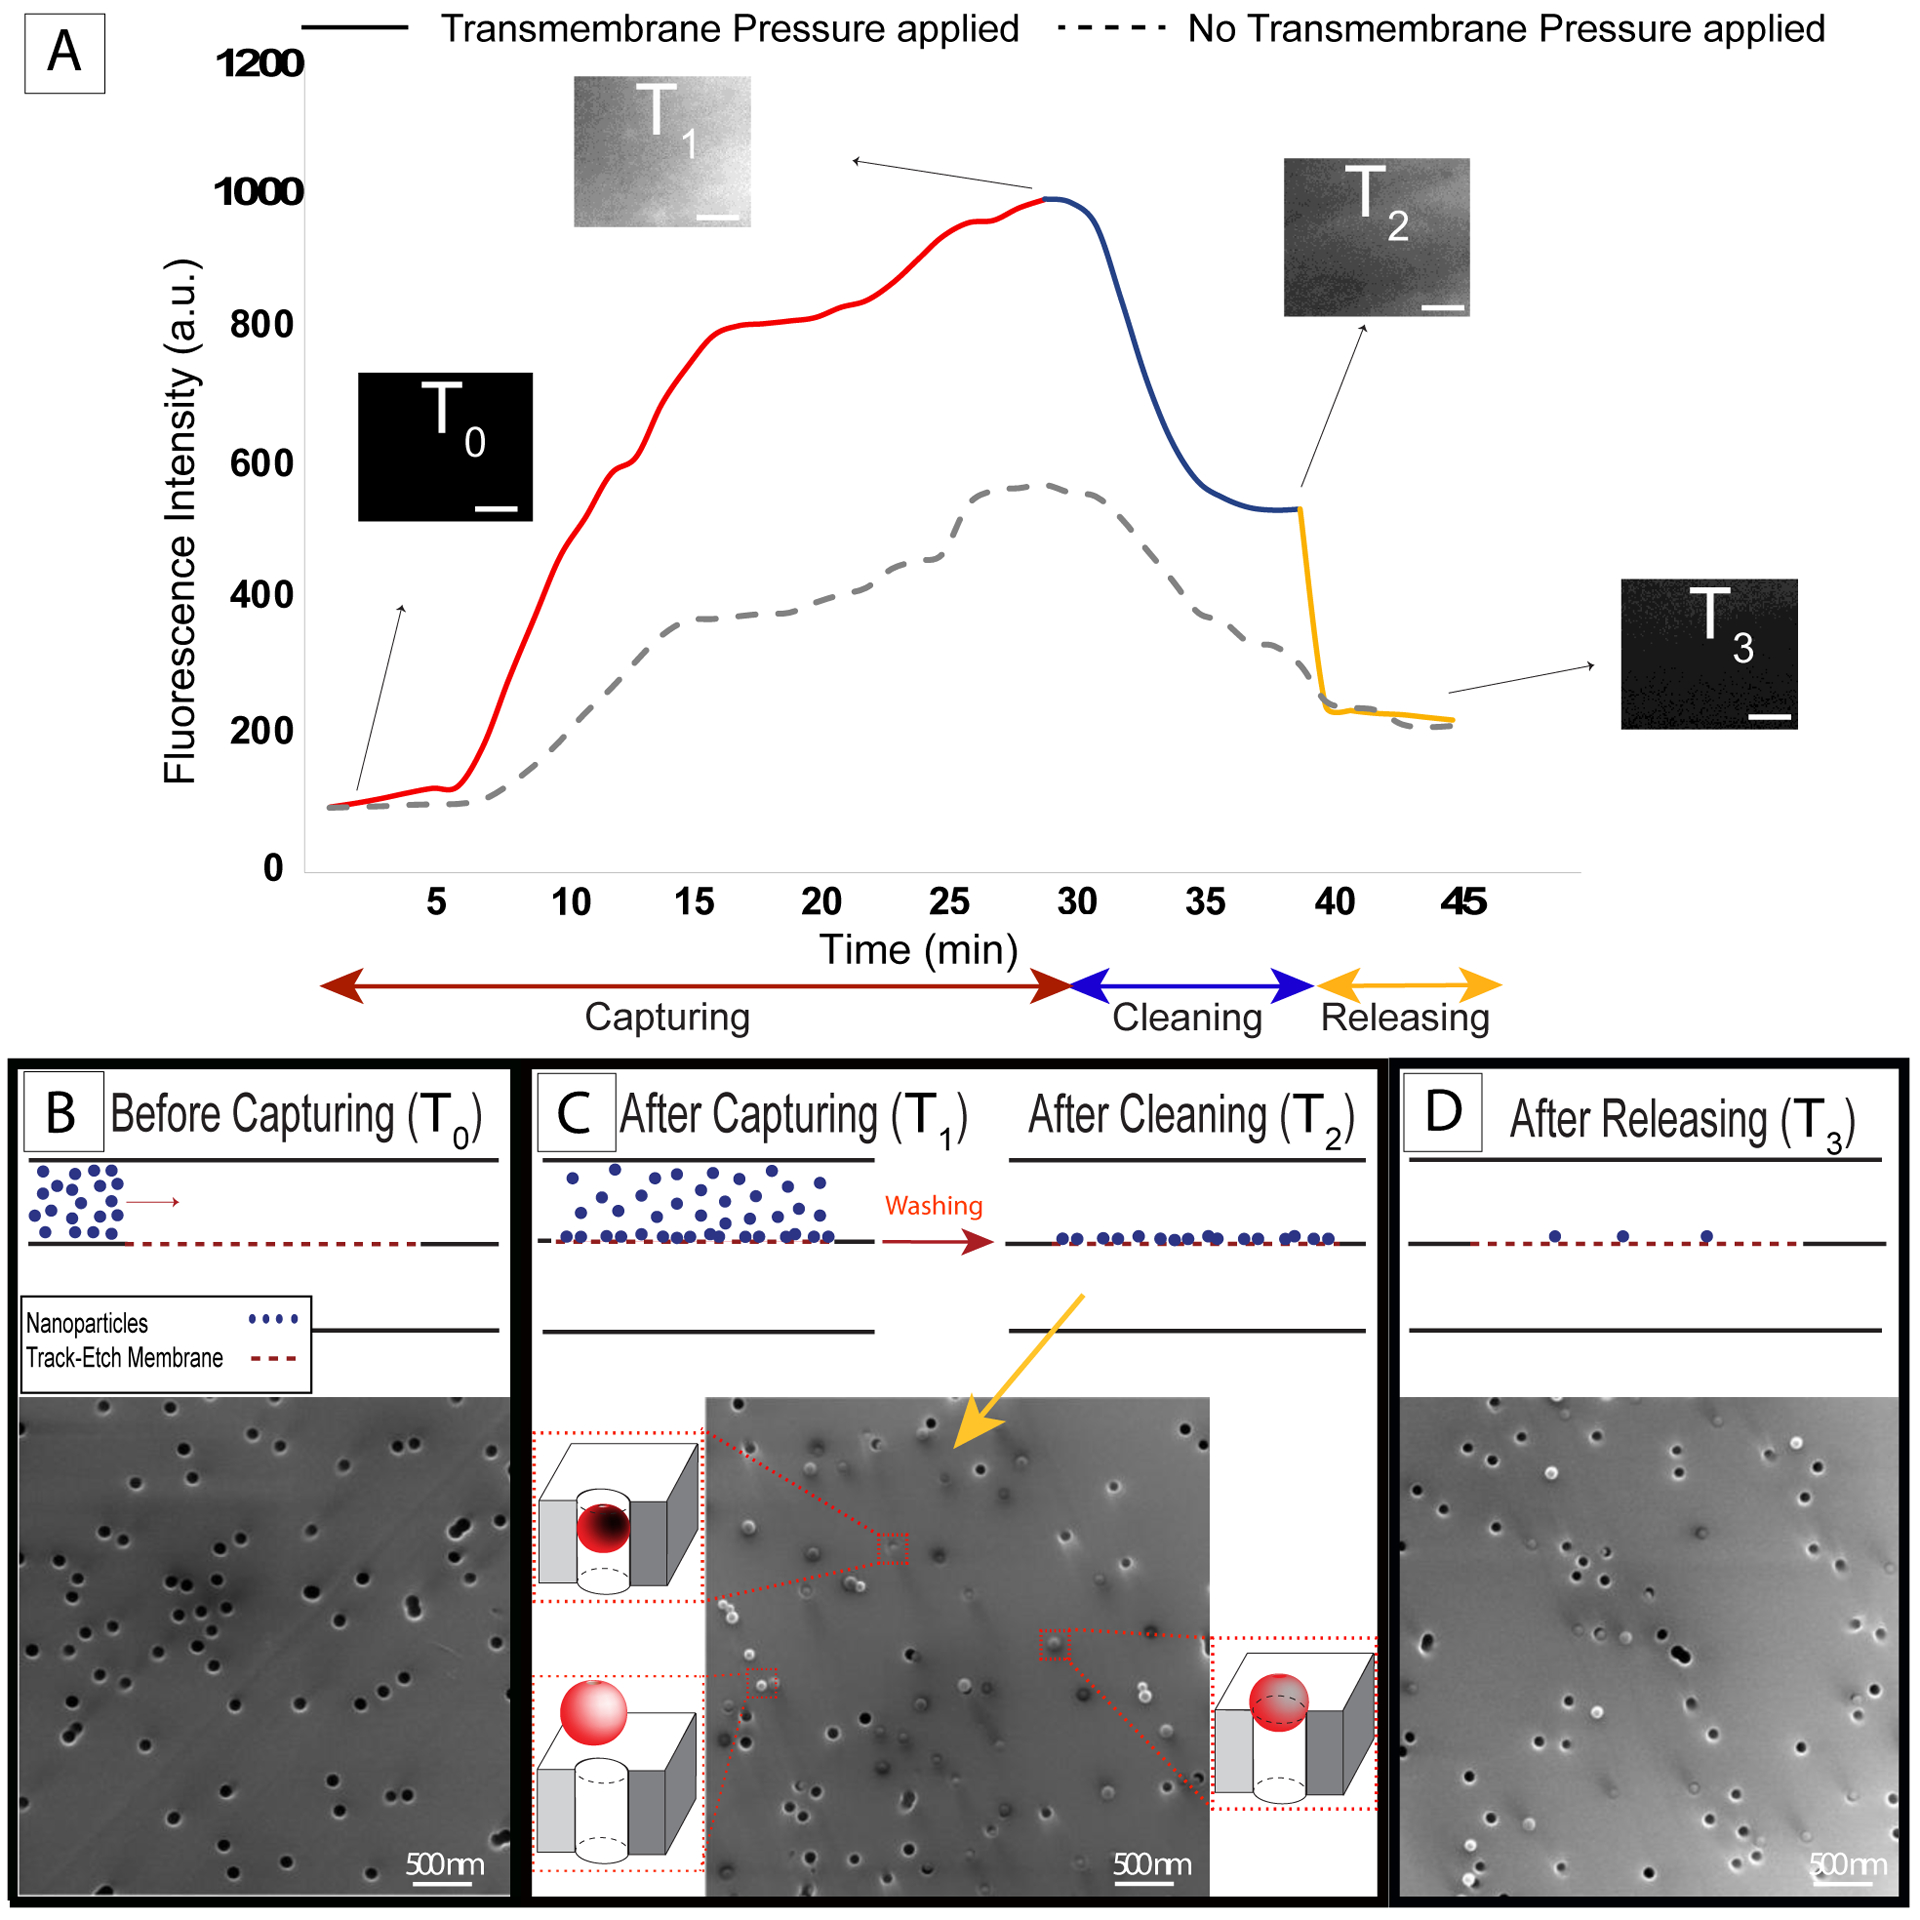
Figure 4: Nanoscale experiments with 100 nm fluorescent particles and 80 nm median pore size polycarbonate track-etch (nPCTE) membranes.

A) Fluorescent intensity analysis (solid line) showing the gradual increasing and decreasing in the fluorescent signal during the capturing step and cleaning step, respectively, followed by a sharp drop as nanoparticles were released (the dash line shows the intensity change during the experiment in the absence of the transmembrane pressure). Scale bar on fluorescence image insets = 50 μm. B, C and D) Electron micrographs showing before capturing, after capturing-cleaning, and after releasing panels, respectively.
