
Figure 6:
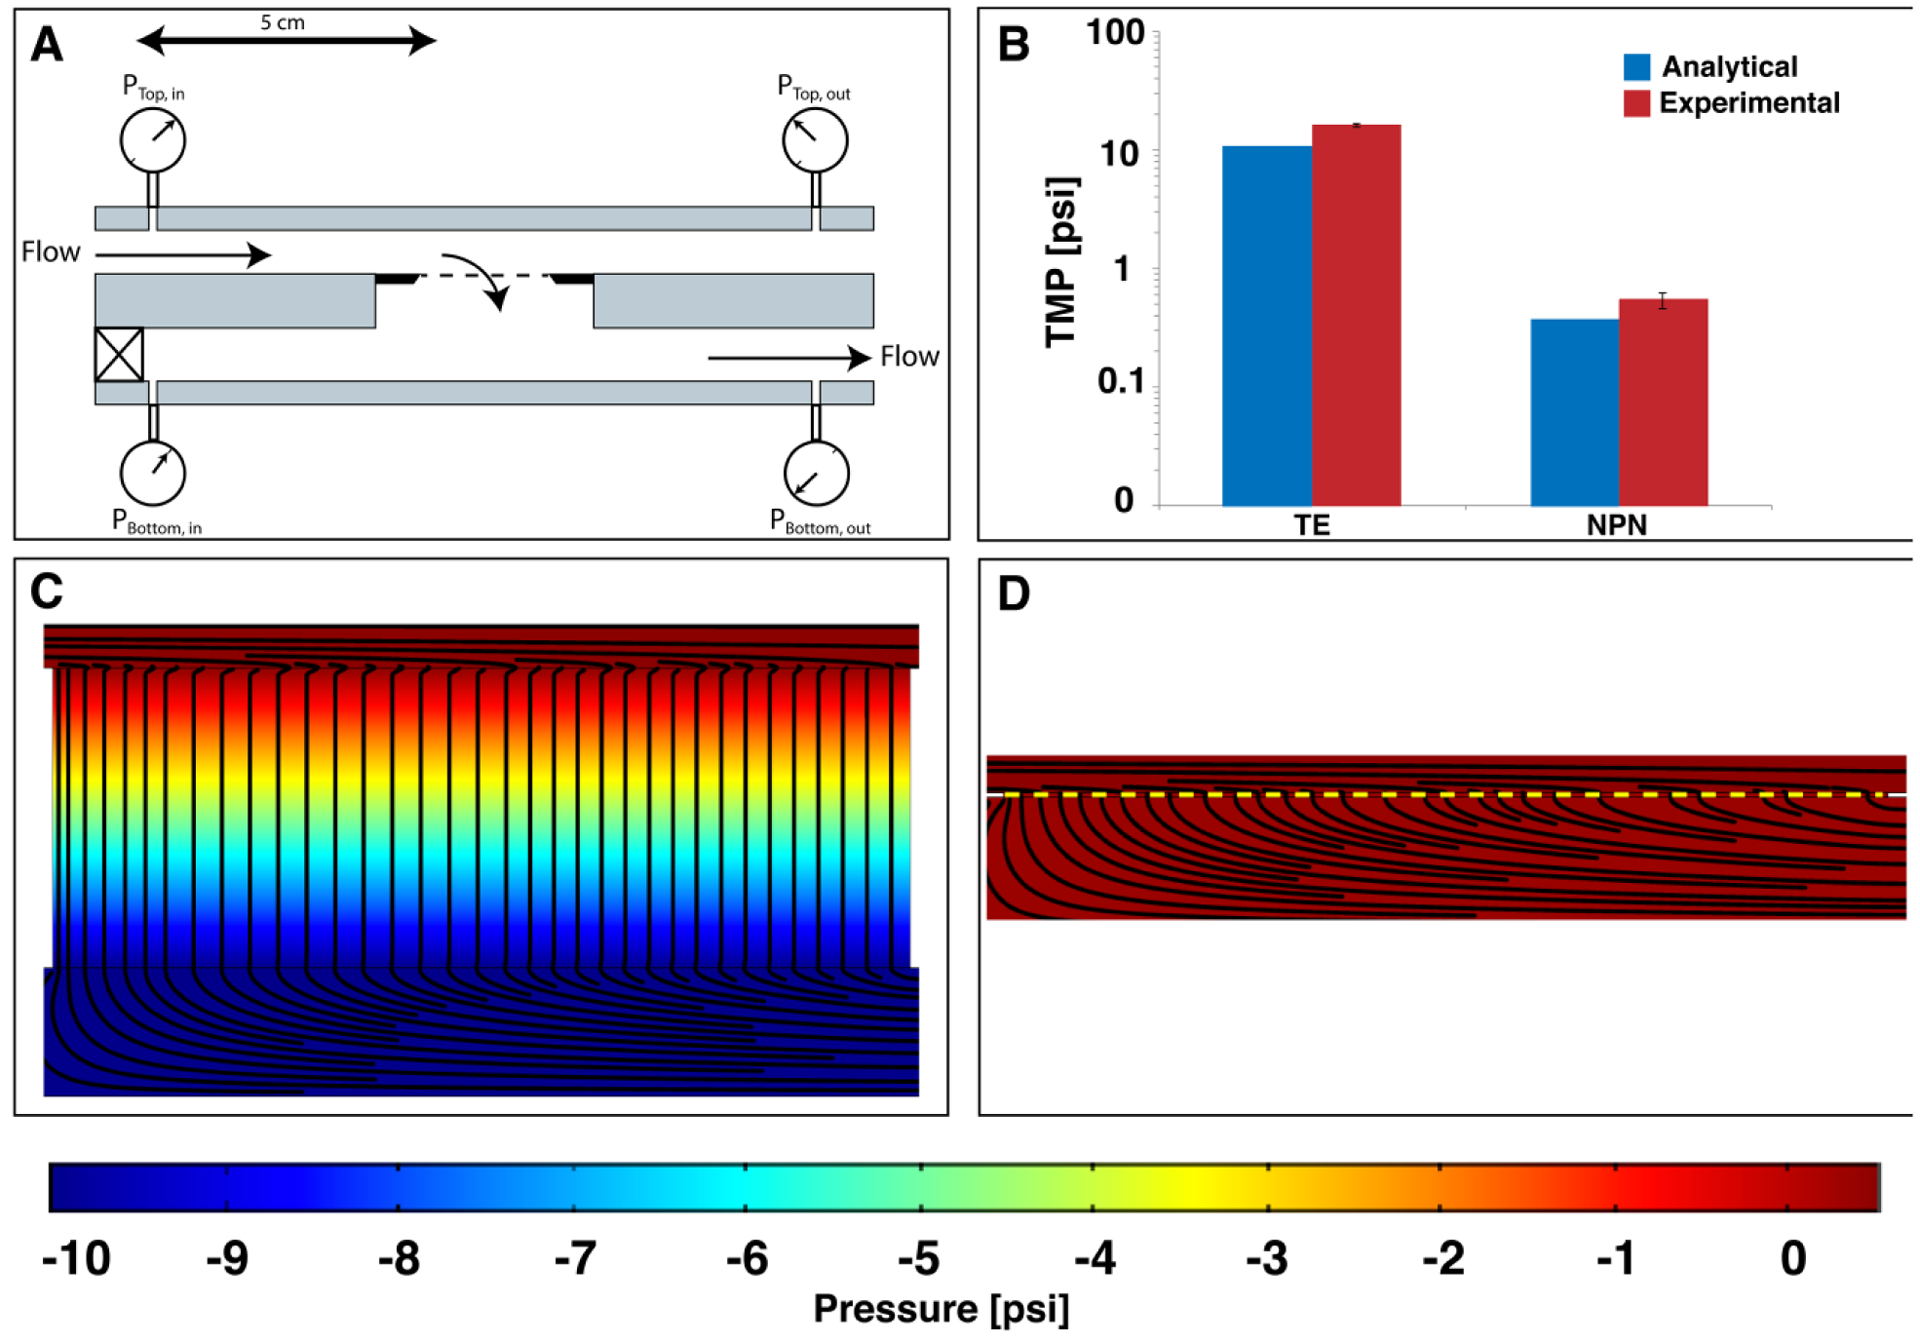
Theoretical and experimental pressure drops across nanoporous polycarbonate track-etch membranes (nPCTE) and nanoporous silicon nitride (NPN) membranes. A) Diagram of the pressure monitoring system showing the position of the pressure sensors and the direction of flow. All flow was performed at 10 μL/min through the membrane with a syringe pump pushing on the top channel and a syringe pump pulling on the bottom channel. The pressure sensors were positioned 5 cm above and below the membrane. B) Comparison of pressure drops across the track-etch and NPN membranes. Blue = Dagan predicted, homogeneous distribution pressure drop. Red = experimental data. Logarithmic scale used for comparison. C) COMSOL model of pressure in a track-etch system showing a large pressure drop across the membrane. D) COMSOL model of pressure in an NPN system showing almost no pressure drop across the membrane, in stark contrast to the track etch system. COMSOL simulations were performed using the Free and Porous Flow toolbox with a Darcy’s permeability calculated for this system.