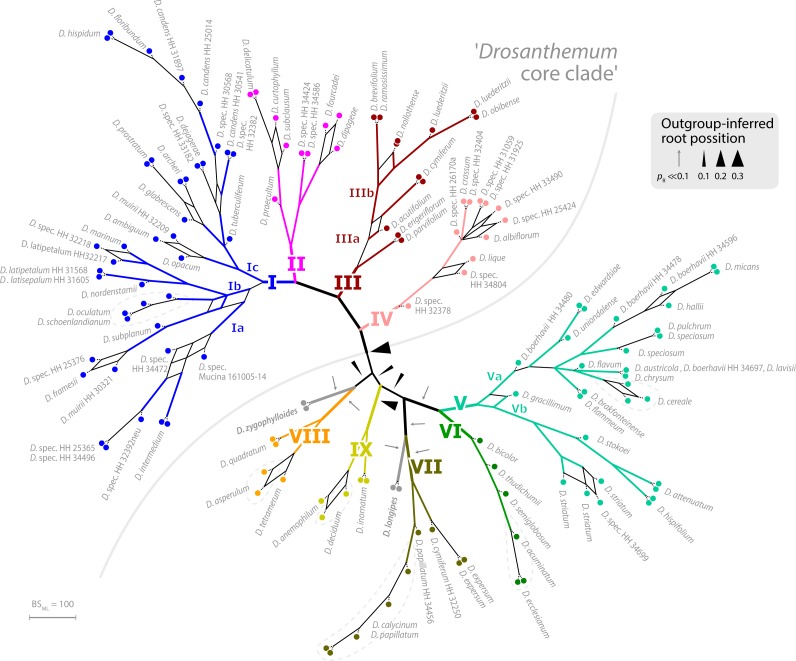
Figure 3. Bootstrap consensus network of Drosanthemum.
Consensus network based on 600 pseudoreplicate samples inferred by partitioned ML analysis of the cpDNA sequence data. Edge lengths are proportional to the frequency of the phylogenetic split in the pseudoreplicate sample. Branch colours and labels are as in Fig. 2. Black arrows indicate potential root positions inferred by outgroup-EPA, with arrow size proportional to the probability estimate pR (Supplemental Information 4, Table S4).

