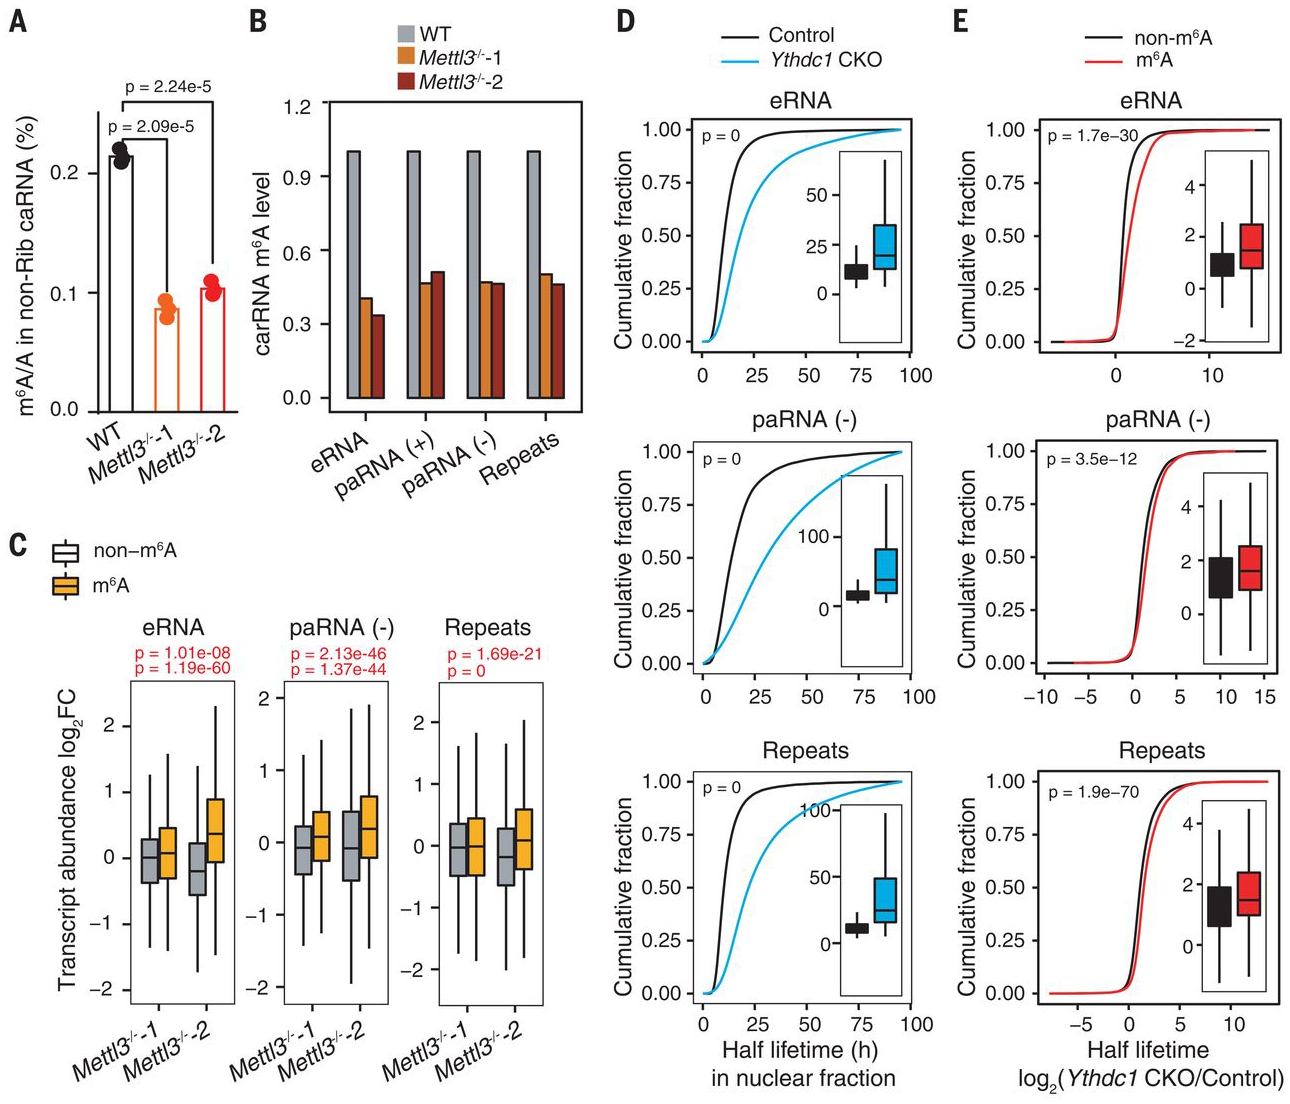
Fig. 2. Transcript turnover of carRNAs is regulated by m6A.

(A) LC-MS/MS quantification of the m6A/A ratio in nonribosomal (non-Rib) caRNAs (including pre-mRNA) extracted from WT or Mettl3−/− mESCs. n = 3 biological replicates; error bars indicate means ± SEM. (B) m6A level changes on carRNAs were quantified through normalizing m6A sequencing results with spike-in between WT and Mettl3 KO mESCs. n = 2 biological replicates. (C) carRNAs were divided into methylated (m6A) or nonmethylated (non-m6A) groups. The boxplot shows greater increases in transcript abundance fold changes of the m6A group versus the non-m6A group upon Mettl3 KO over WT mESCs. For (A) and (C), P values were determined by two-tailed t test. (D) Cumulative distribution and boxplots (inside) of nuclear carRNA half lifetime changes in CKO Ythdc1 and control mESCs. (E) Cumulative distributions and boxplots (inside) of the half lifetime changes of carRNAs upon Ythdc1 CKO. carRNAs were divided into methylated (m6A) or nonmethylated (non-m6A) groups. Depletion of YTHDC1 led to greater half lifetime increases of m6A-marked carRNAs than non-m6A–marked ones. For (D) and (E), P values were calculated by a nonparametric Wilcoxon-Mann-Whitney test. h, hours.
