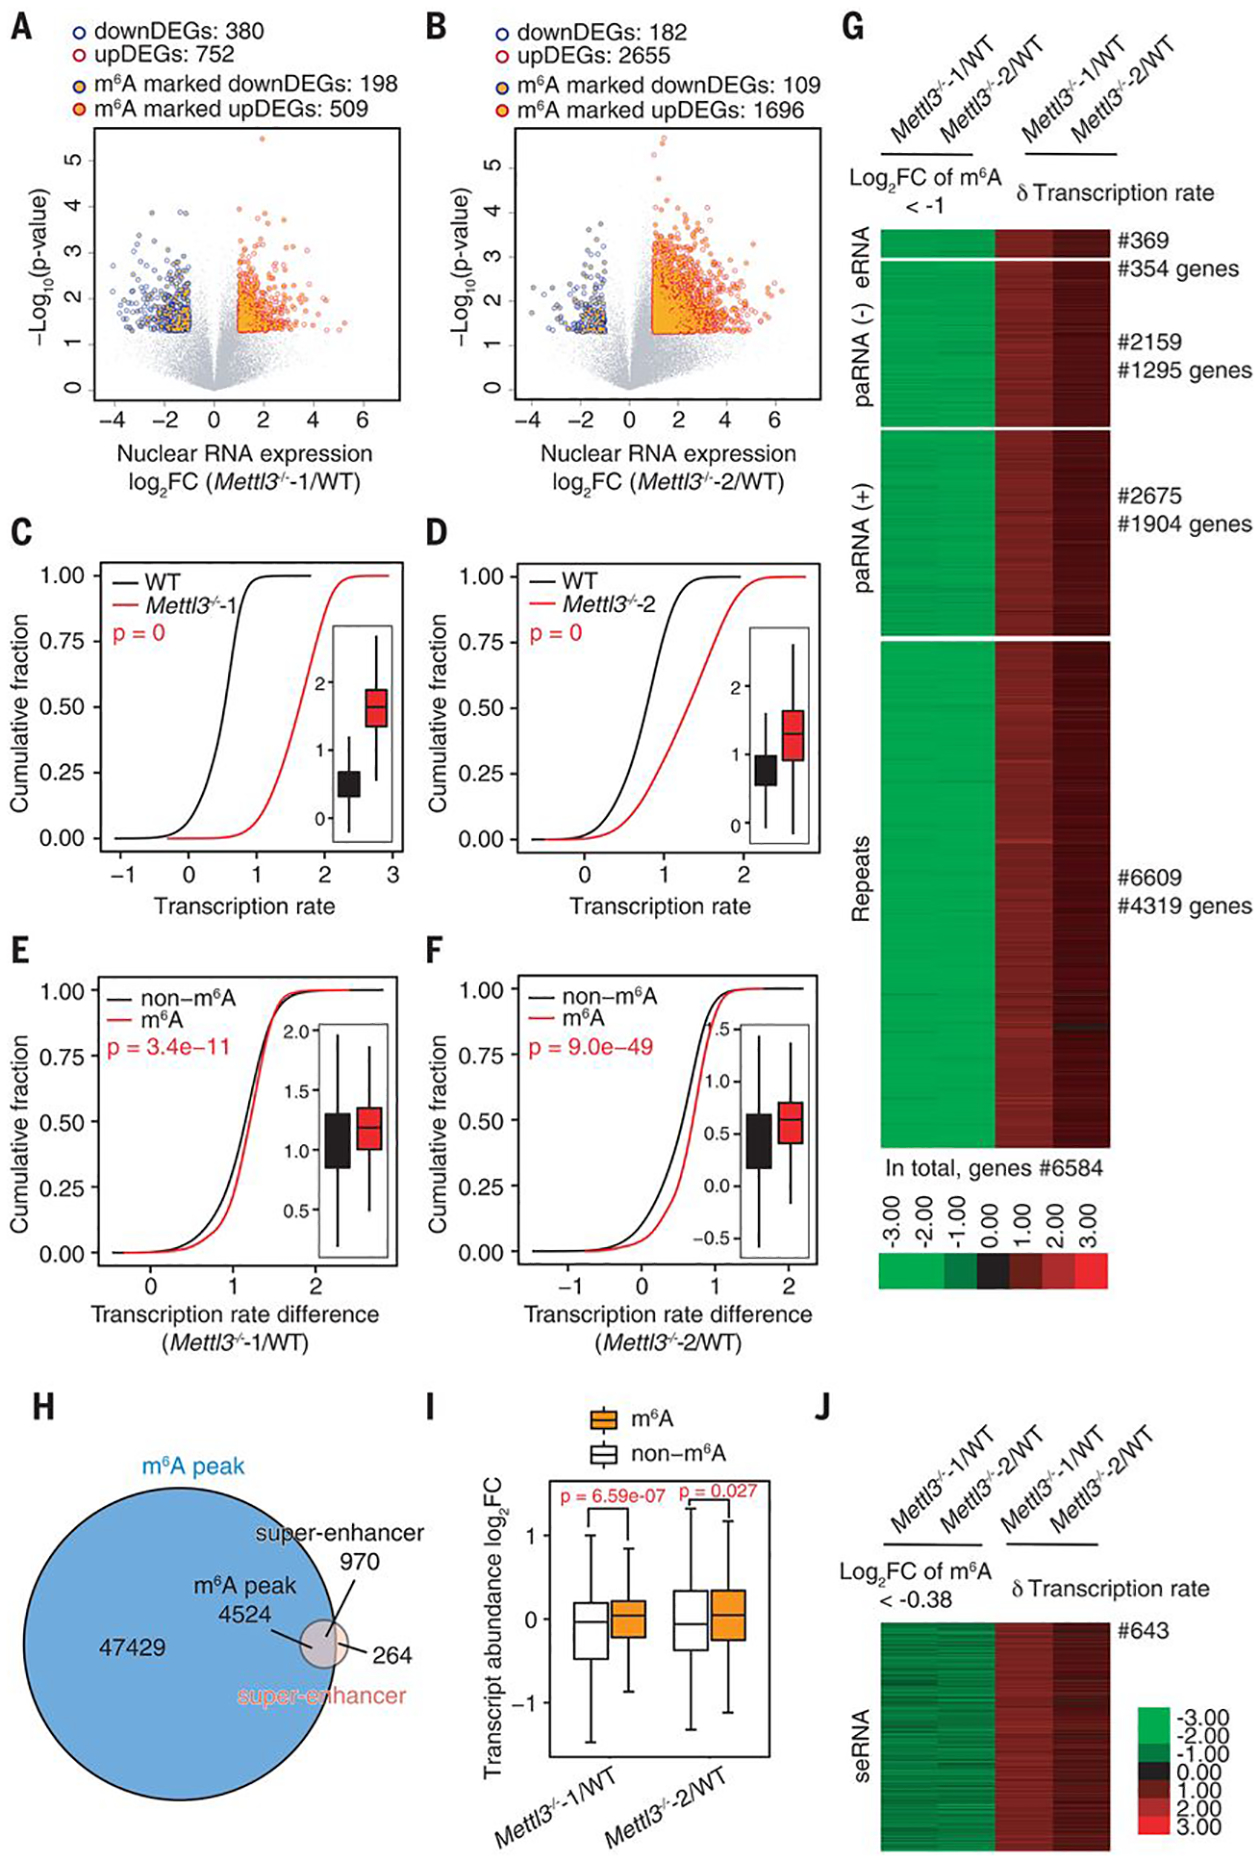
Fig. 3. The m6A level of carRNAs affects downstream gene expression and transcription rate.

(A and B) Volcano plot of genes with differential expression levels in Mettl3−/−−1 (A) or Mettl3−/−−2 (B) versus WT mESCs [P < 0.05 and |log2FC| > 1 (FC, fold change)]. Genes with upstream, m6A-marked carRNAs are shown with orange circles. Gene expression level was normalized to ERCC spike-in with linear regression method. DEG, differentially expressed gene. (C and D) Cumulative distribution and boxplot (inside) of gene transcription rate in Mettl3−/−−1 (C) or Mettl3−/−−2 (D) versus WT mESCs. (E and F) Cumulative distribution and boxplot (inside) of transcription rate difference between Mettl3−/−−1 (E) or Mettl3−/−−2 (F) versus WT mESCs. Genes were categorized into two subgroups according to whether their upstream carRNAs contain m6A (m6A) or not (non-m6A). For (C) to (F), P values were calculated by a nonparametric Wilcoxon-Mann-Whitney test. (G) Heatmap showing the m6A level fold changes (log2FC < −1) on carRNAs and downstream gene transcription rate difference between Mettl3 KO and WT mESCs. (H) Venn diagram showing the overlap between the m6A peaks and super-enhancer peaks in mESCs. (I) Boxplot showing fold changes of the abundance of m6A-marked and non-m6A–marked seRNAs between Mettl3−/− and WT mESCs. For (A), (B), and (I), P values were determined by two-tailed t test. (J) Heatmap showing fold change (log2FC < −0.38) of m6A level of seRNAs and transcription rate difference of their downstream genes between Mettl3 KO and WT mESCs.
