
Fig. 3. IL-1β acts as a galectin-3–induced paracrine signal in fibroblasts.
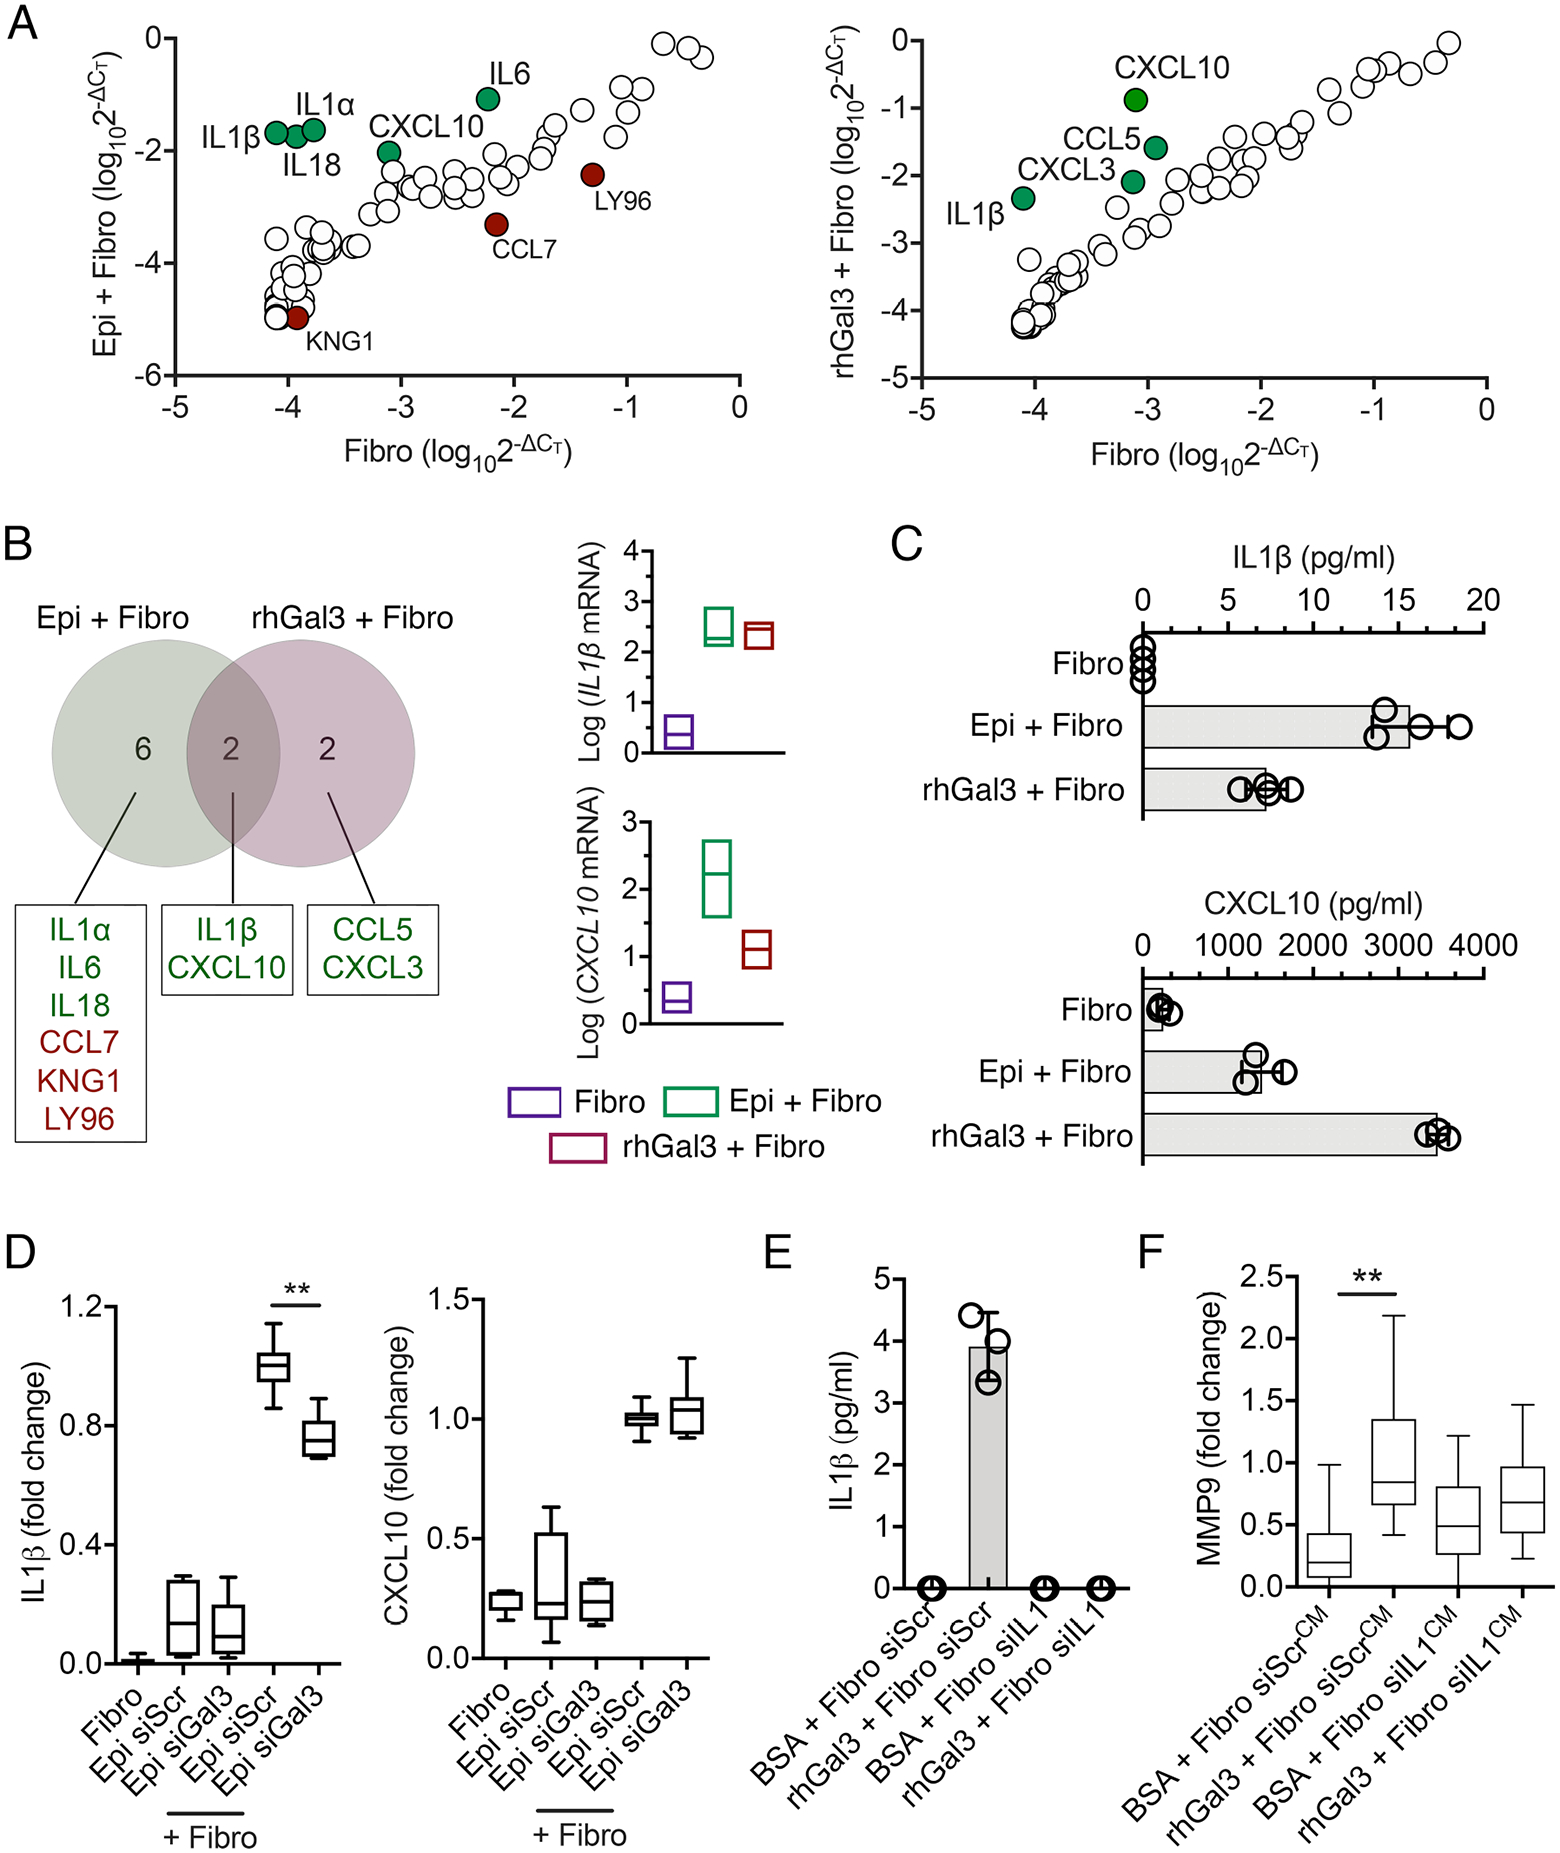
(A) Relative gene expression from PCR arrays on a mixed coculture system (Epi + Fibro) or fibroblasts exposed to exogenous soluble galectin-3 (rhGal3 + Fibro) for 24 h. Data were normalized to cultures of fibroblasts grown alone with no stimulation. The green and red dots indicate significant increases or decreases compared to the control, respectively. n = 3 independent experiments. (B) Venn diagram representation of genes showing increased and decreased expression in coculture conditions or in fibroblasts exposed to galectin-3, as determined by PCR array. The expression amounts of the two overlapping genes are shown for each individual condition. n = 3 independent experiments. (C) ELISA showing the amounts of IL-1β and CXCL10 in culture supernatants obtained from the conditions in (A). n = 4 (IL-1β) or n = 3 (CXCL10) independent experiments. (D) Epithelial cells were transfected with scrambled (siScr) or galectin-3 (siGal3) siRNA. After 48h of transfection, cells were incubated with fibroblasts in a mixed coculture system for an additional 24 h. IL-1β and CXCL10 amounts in culture supernatants were quantified by ELISA. n = 6 independent experiments. (E) Fibroblasts were transfected with siScr or IL-1β siRNA (siIL1). After 48h of transfection, cells were incubated with BSA or rhGal3 in serum-free media for an additional 24 h. IL-1β amounts in culture supernatants were quantified by ELISA. n = 3 independent experiments. (F) Culture supernatants obtained from the conditions in (E) were pre-cleared twice with α-lactose agarose beads to remove endogenous galectin-3 prior to incubation with epithelial cells. After 24 h, the gelatinase (MMP9) activity of epithelial cell culture supernatants was quantified by gelatin zymography. n = 4 independent experiments. The box and whisker plots show the 25 and 75 percentiles (box), the median, and the minimum and maximum data values (whiskers). The data in (C) and (E) represent the mean ± S.D. Significance was determined using one-way ANOVA with Tukey’s post hoc test. **, p<0.01.