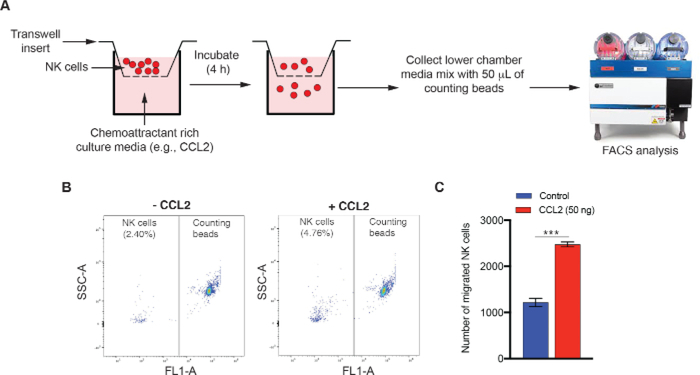
Figure 3: FACS-based quantitative NK cell migration assay.
(A) Schematic depicting the key steps of FACS-based NK cell migration assay. (B,C) NK cell migration assay was carried out after adding 50 ng of CCL2 to the bottom chamber of the 24 well plate. (B) Representative NK cell migration dot plots for control or CCL2-treated culture medium are shown. (C) NK cell migration data (mean ± SEM) is presented for the experiment shown in panel B. ***p < 0.001.

