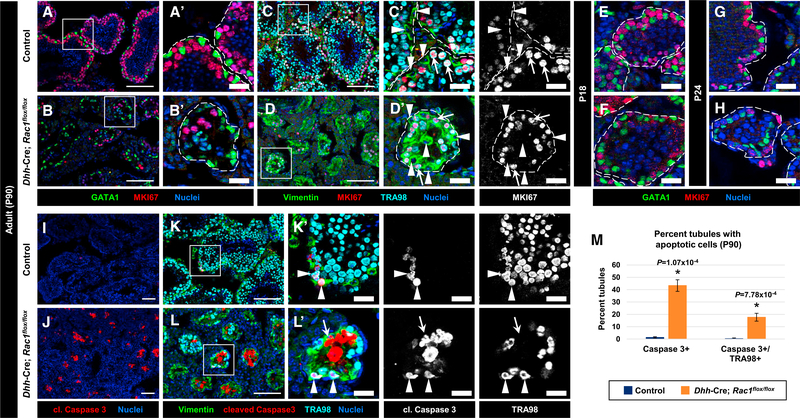
Figure 2. Cell-Cycle Status and Onset of Sertoli Cell Quiescence Is Normal in Rac1 cKO Testes.
(A–L) Three-month-old (P90) (A–D, I–L), P18 (E and F), and P24 (G and H) control Dhh-Cre;Rac1flox/+ (A, C, E, G, I, and K) and Dhh-Cre;Rac1flox/flox cKO (B, D, F, H, J, and L) testes. (A)–(D’), (K’), and (L’) are higher-magnification images of the boxed regions in (A)–(D), (K), and (L).
(A and B) Both P90 control (A) and cKO (B) GATA1+ Sertoli cells are negative for MKI67.
(C and D) While vimentin+ Sertoli cells are MKI67− (arrowheads), TRA98+ germ cells are MKI67+ (arrows) in both control (C) and cKO (D) testes.
(E–H) Both control (E and G) and cKO (F and H) Sertoli cells are MKI67 at P18 (E and F) and P24 (G and H).
(I and J) Relative to controls (I), cKO testes (J) show an increase in cell death within tubules.
(K and L) While virtually all of the apoptotic cells in control testes (K) are TRA98+ germ cells (arrowheads), some vimentin+ Sertoli cells are apoptotic in cKO (L) tubules (arrow in L). Dashed outlines indicate tubule boundaries. Thin scale bar, 100 μm; thick scale bar, 25 μm.
(M) Average percentage of tubules containing cleaved caspase 3+ cells or cleaved caspase 3/TRA98++ cells in P90 control versus cKO testes (n = 50 tubules each from 3 independent males).
The data are represented as means ± SDs. p values were performed via a two-tailed Student’s t test.

