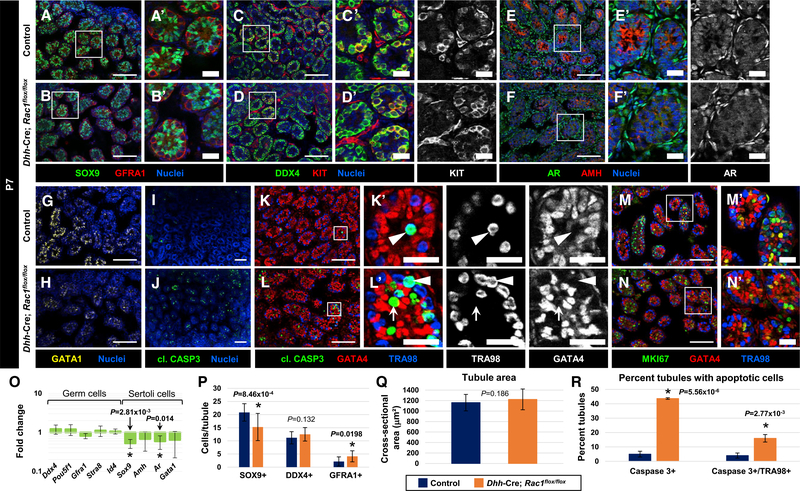
Figure 6. Sertoli Rac1 Function Is Largely Dispensable for Postnatal Testicular Development.
(A–N) P7 control Rac1flox/flox (A, C, E, G, I, K, and M) and Dhh-Cre;Rac1flox/flox cKO (B, D, F, H, J, L, and N) testes. (A’)–(F’) and (K’)–(N’) are higher-magnification images of the boxed regions in (A)–(F) and (K)–(N).
(A–D) As in controls (A and C), P7 cKO testes (B and D) possess SOX9+ Sertoli cells, GFRA1+ undifferentiated spermatogonia, and DDX4+/KIT+ differentiating spermatogonia. Germ cells in cKO testes, similar to controls, have migrated to the tubule periphery.
(E–H) Compared to controls (E and G), P7 cKO testes (F and H) express slightly lower levels of AMH, less nuclear AR in Sertoli cells (although interstitial expression and nuclear localization are normal), and slightly lower levels of GATA1.
(I and J) Relative to controls (I), a significant increase in apoptosis is observed in cKO tubules (J).
(K and L) Apoptosis is observed in mostly TRA98+ germ cells (arrowheads) in controls (K), but it is also observed in Sertoli cells (arrows) in cKO testes (L).
(M and N) Most Sertoli and germ cells in both controls (M) and cKO tubules (N) are MKI67+. Thin scale bar, 100 μm; thick scale bar, 25 μm.
(O) Quantitative real-time PCR analyses reveal no difference in germ cell gene expression in P7 control versus cKO testes (Ddx4, Pou5f1, Gfra1, Stra8, and Id4), but they do reveal a significant reduction in the Sertoli-expressed genes Sox9 and Ar, with no significant change in Amh and Gata1 expression (n = 4–6 testes for controls and cKO, each from independent males).
(P) Graph showing slightly reduced Sertoli cell numbers in P7 cKO testes, but no loss of either DDX4+ or GFRA1+ germ cells (n = 10 tubules each from 3 testes, each testis from independent males).
(Q) Average tubule cross-sectional area of P7 control versus cKO testes (n = 10 tubules each from 3 independent males).
(R) Average number of tubules with CASP3+ cells and CASP3+/TRA98+ germ cells in P7 control versus cKO testes (n = 50 tubules each from 3 independent males).
The data in (O)–(R) are shown as means ± SDs. p values were calculated using a two-tailed Student’s t test.
See also Figures S5 and S6.

