
Figure 3.
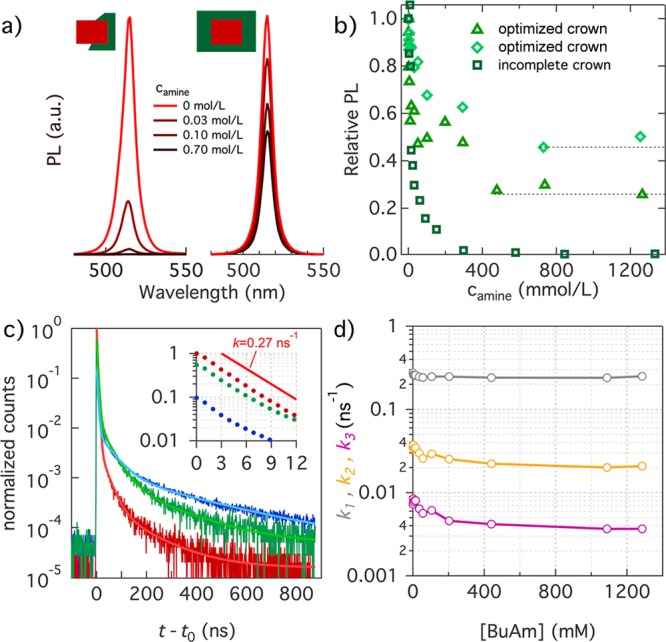
(a) PL spectra of CdSe/CdS core/crown NPLs at different steps during a BuNH2 titration, including (left) incomplete core/crown and (right) optimized core/crown NPLs. For both samples, PL spectra have been normalized relative to the initial spectrum, i.e., before BuNH2 addition. (b) Evolution of the relative PLQY during BuNH2 titration for (squares) NPLs with an incomplete crown and (diamonds and triangles) two different samples synthesized following the optimized procedure. (c) Transient PL of the (red) initial sample, (green) the sample after addition of 55 mM BuNH2, and (blue) the sample after addition of 1285 mM BuNH2. Lighter color lines correspond to the three-exponential fits. The inset is a close-up of the first 15 ns of the decay with the traces normalized to their respective PLQY. The reference line represents a single-exponential decay with an emission rate of 0.27 ns–1. (d) Different rate constants obtained by fitting a three-exponential decay to the transient PL as a function of BuNH2 concentration.