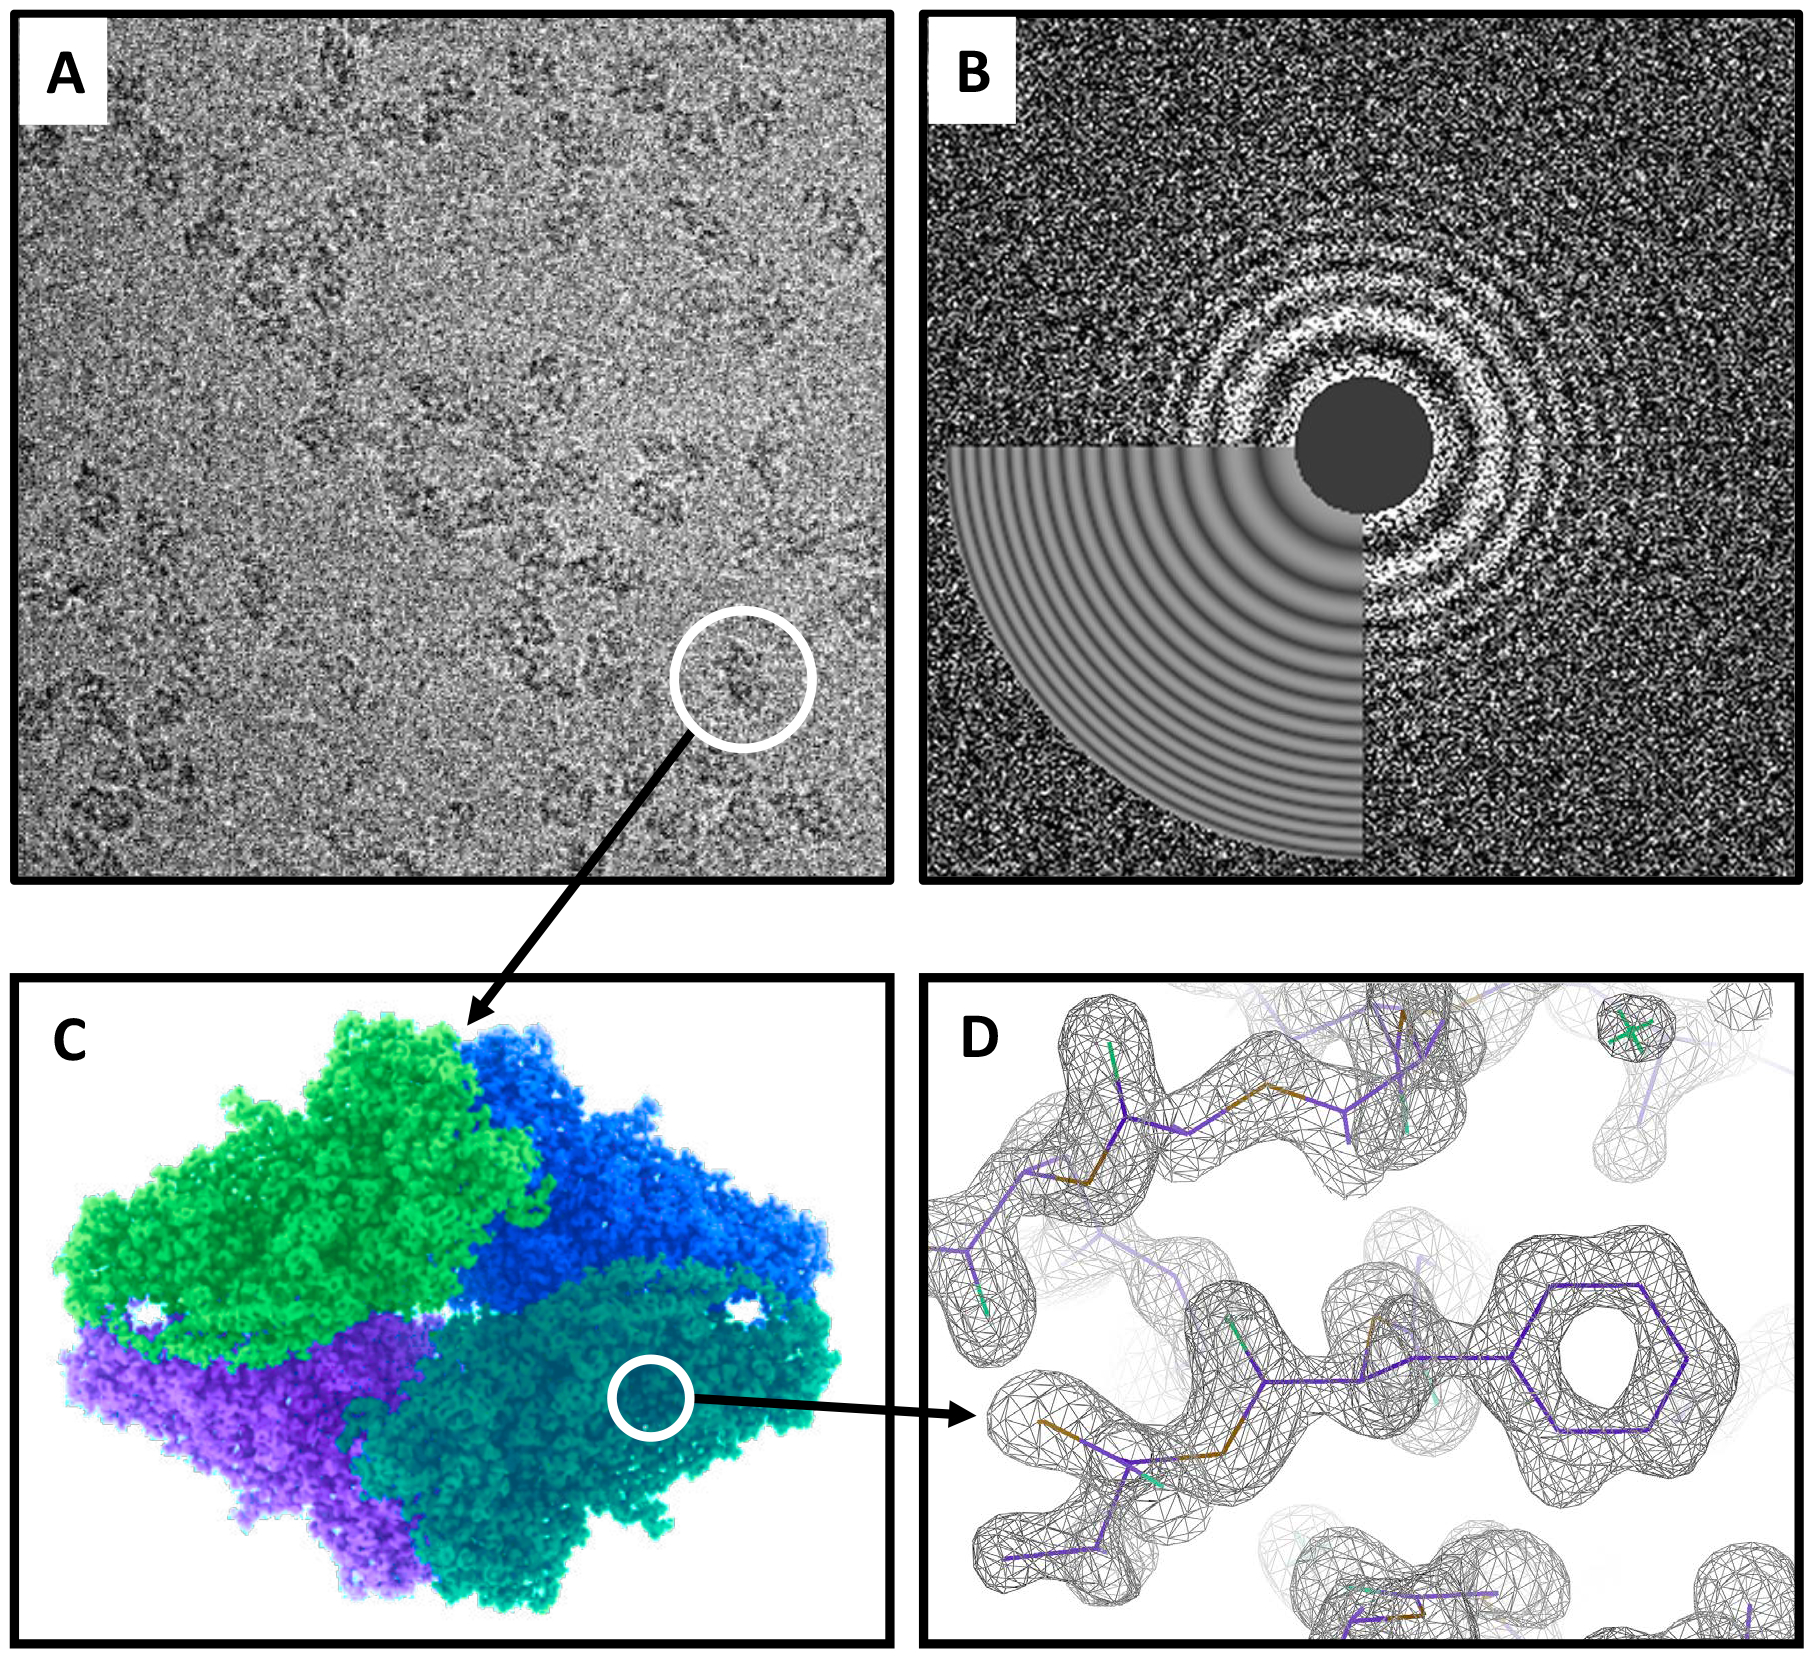
Fig. 2:

High-resolution cryo-EM imaging of the β-galactosidase enzyme in complex with a cell-permeant inhibitor. A) Micrograph of β-galactosidase showing individual particle projections (indicated with white circle). B) Power spectra of image shown in panel A and estimated contrast transfer function (CTF) matching the characteristic Thon ring oscillations (see Section V-B). C) 1.9Å resolution map obtained from ~ 150, 000 individual particle projections extracted from the publicly available dataset EMPIAR-10061 [16], [15]. D) Close-up view of reconstruction shown in panel C highlighting high-resolution features of the map at the individual amino acid level.
