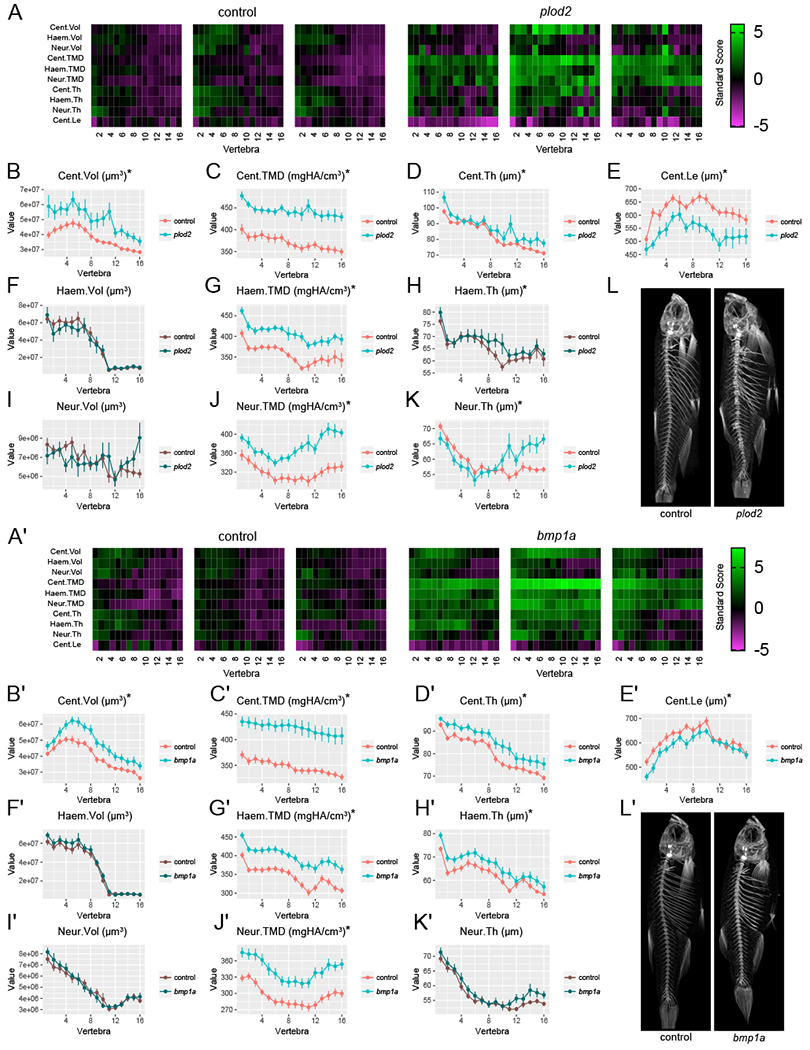
Figure 2. FishCuT analysis of somatic mutants.

(A,A’) Skeletal barcodes visually depict individual phenomes for control and plod2 (A) or bmpla (A’) somatic mutant fish (3 fish/group shown). See STAR Methods for barcode quantification. (B-K,B’-K’) Phenotypic features, indicated by the graph title (with units for y-axis), are plotted as a function of vertebra along the axial skeleton. Plots associated with p<0.05 in the global test are in a lighter coloring scheme and are indicated by an asterisk (mean ± SE, see text for p-values). For plod2 (B-K) n=11/group, and for bmpla (B’-K’) n=15/group. Data for all 25 combinatorial measures are presented in Figure S4 and S5. Cent, centrum; Haem, haemal arch, Neur, neural arch; Vol, volume; TMD, tissue mineral density; Th, thickness; Le, length. (L,L’) Representative maximum intensity projections of microCT scans for plod2 (L) and bmpla (L’) somatic mutant fish and controls.
