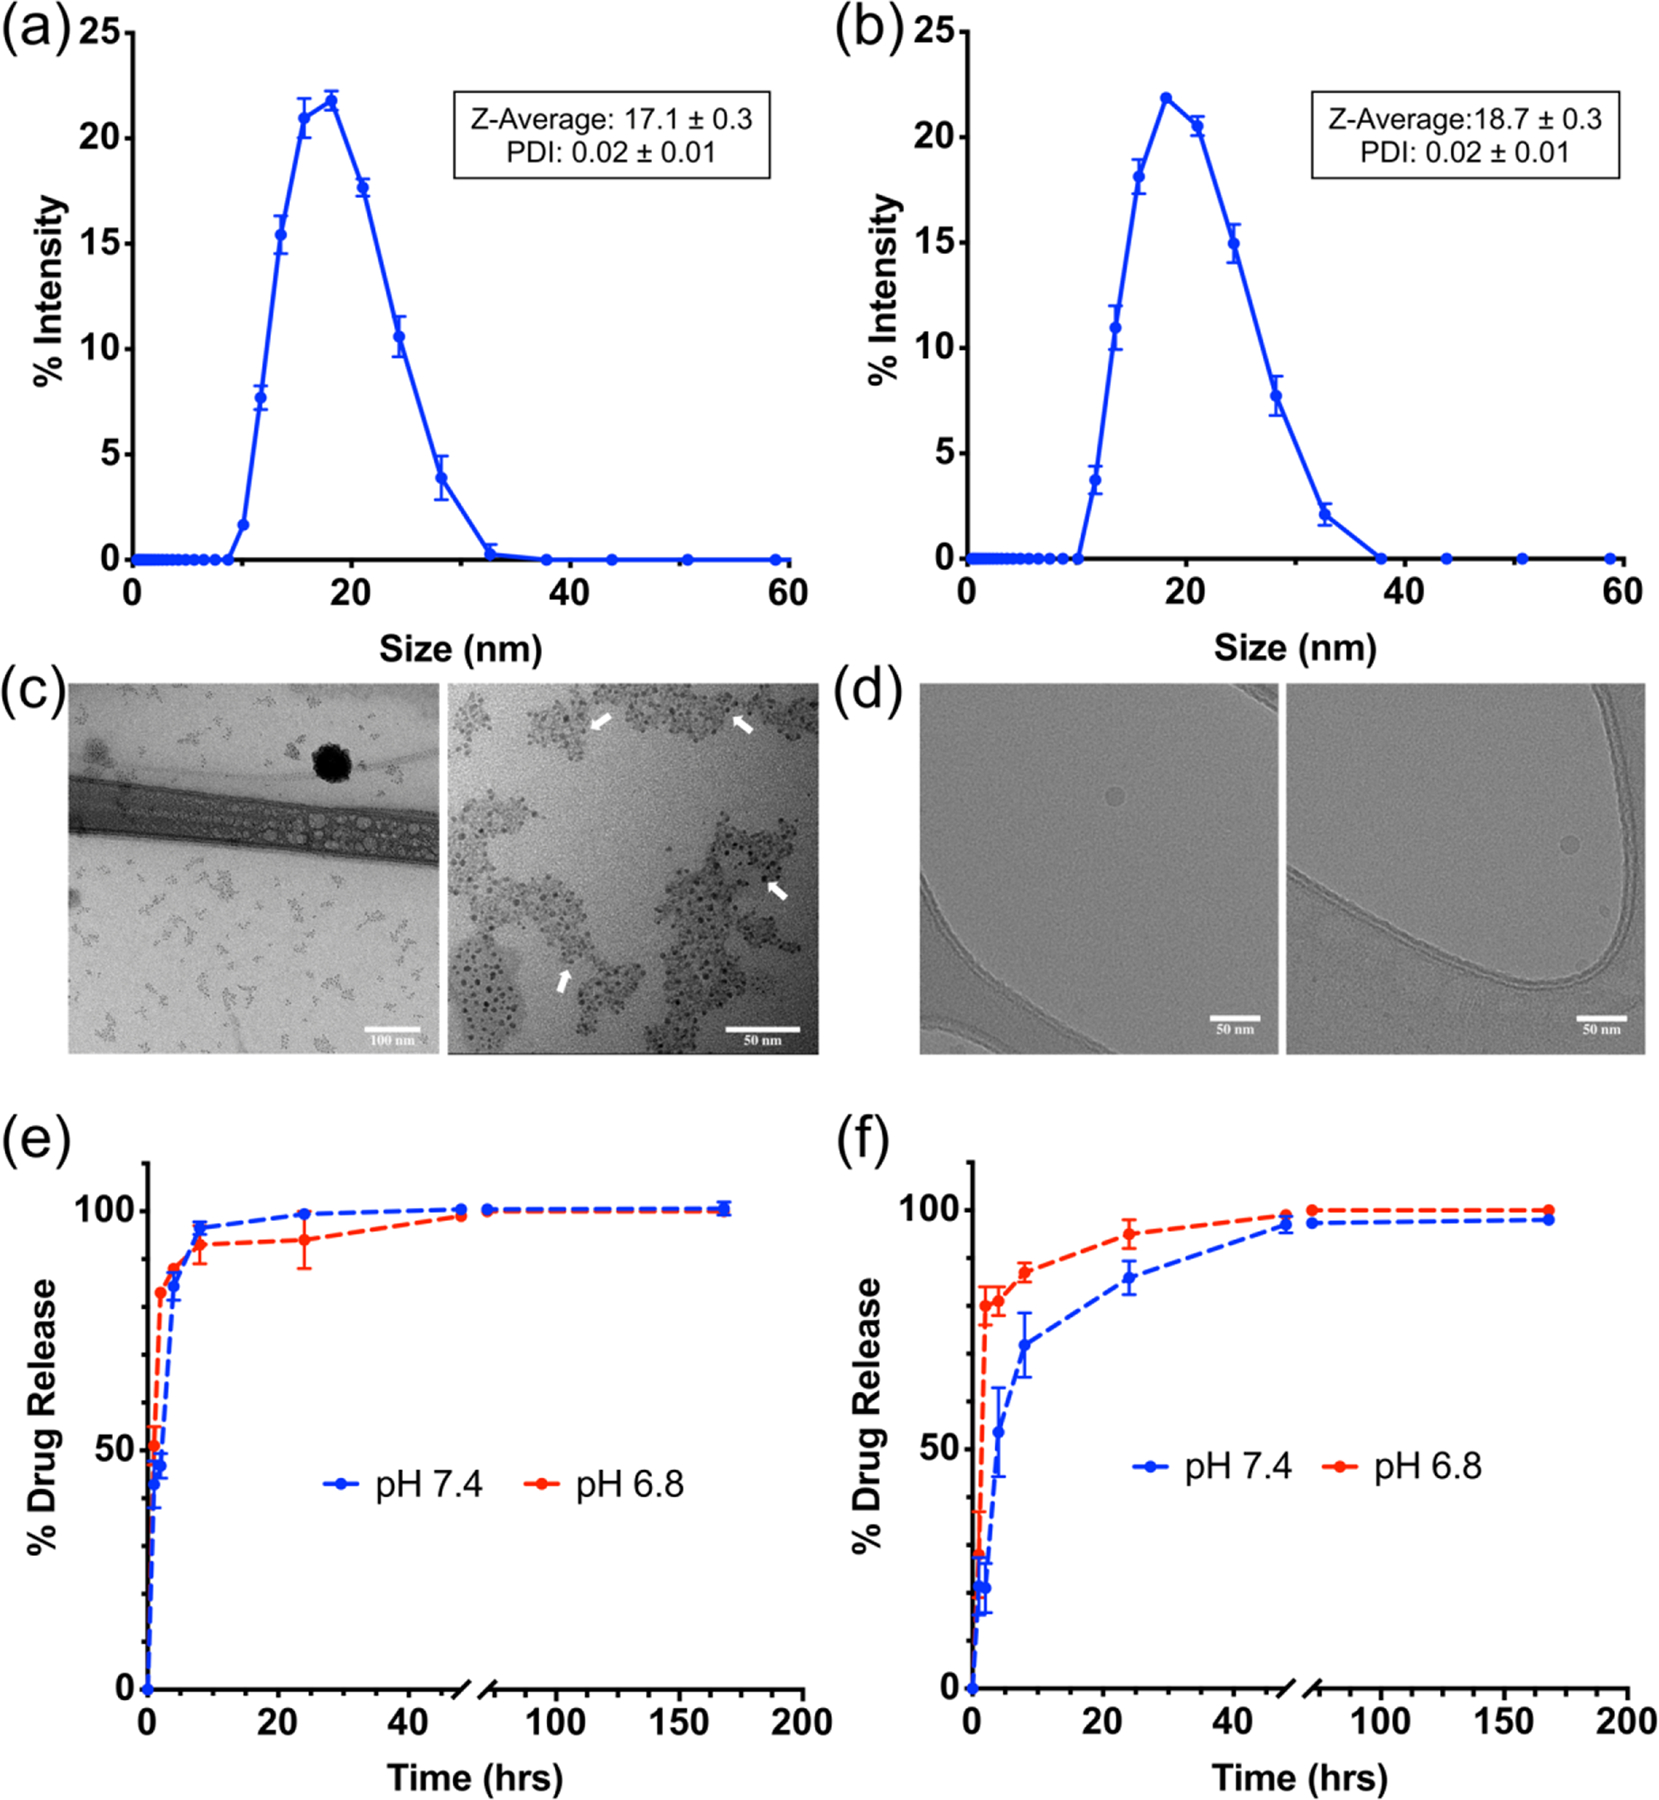
Figure 1.

Intensity average hydrodynamic diameter measured by dynamic light scattering for (a) E MPMs (b) TB MPMs. (c) Transmission Electron Microscopy (TEM) shows a core size around 4 nm, individual cores shown by white arrows. Scale bar of left image is 100 nm and right image is 50 nm. (d) CryoTEM demonstrates an overall size closer to the hydrodynamic radius measured by DLS. Scale bar is 50 nm in both images. In vitro drug release profile of (e) talazoparib and (f) buparlisib from dual drug-loaded MPMs under sink conditions in PBS at pH 7.4 or 6.8 as determined by quantitative HPLC.
