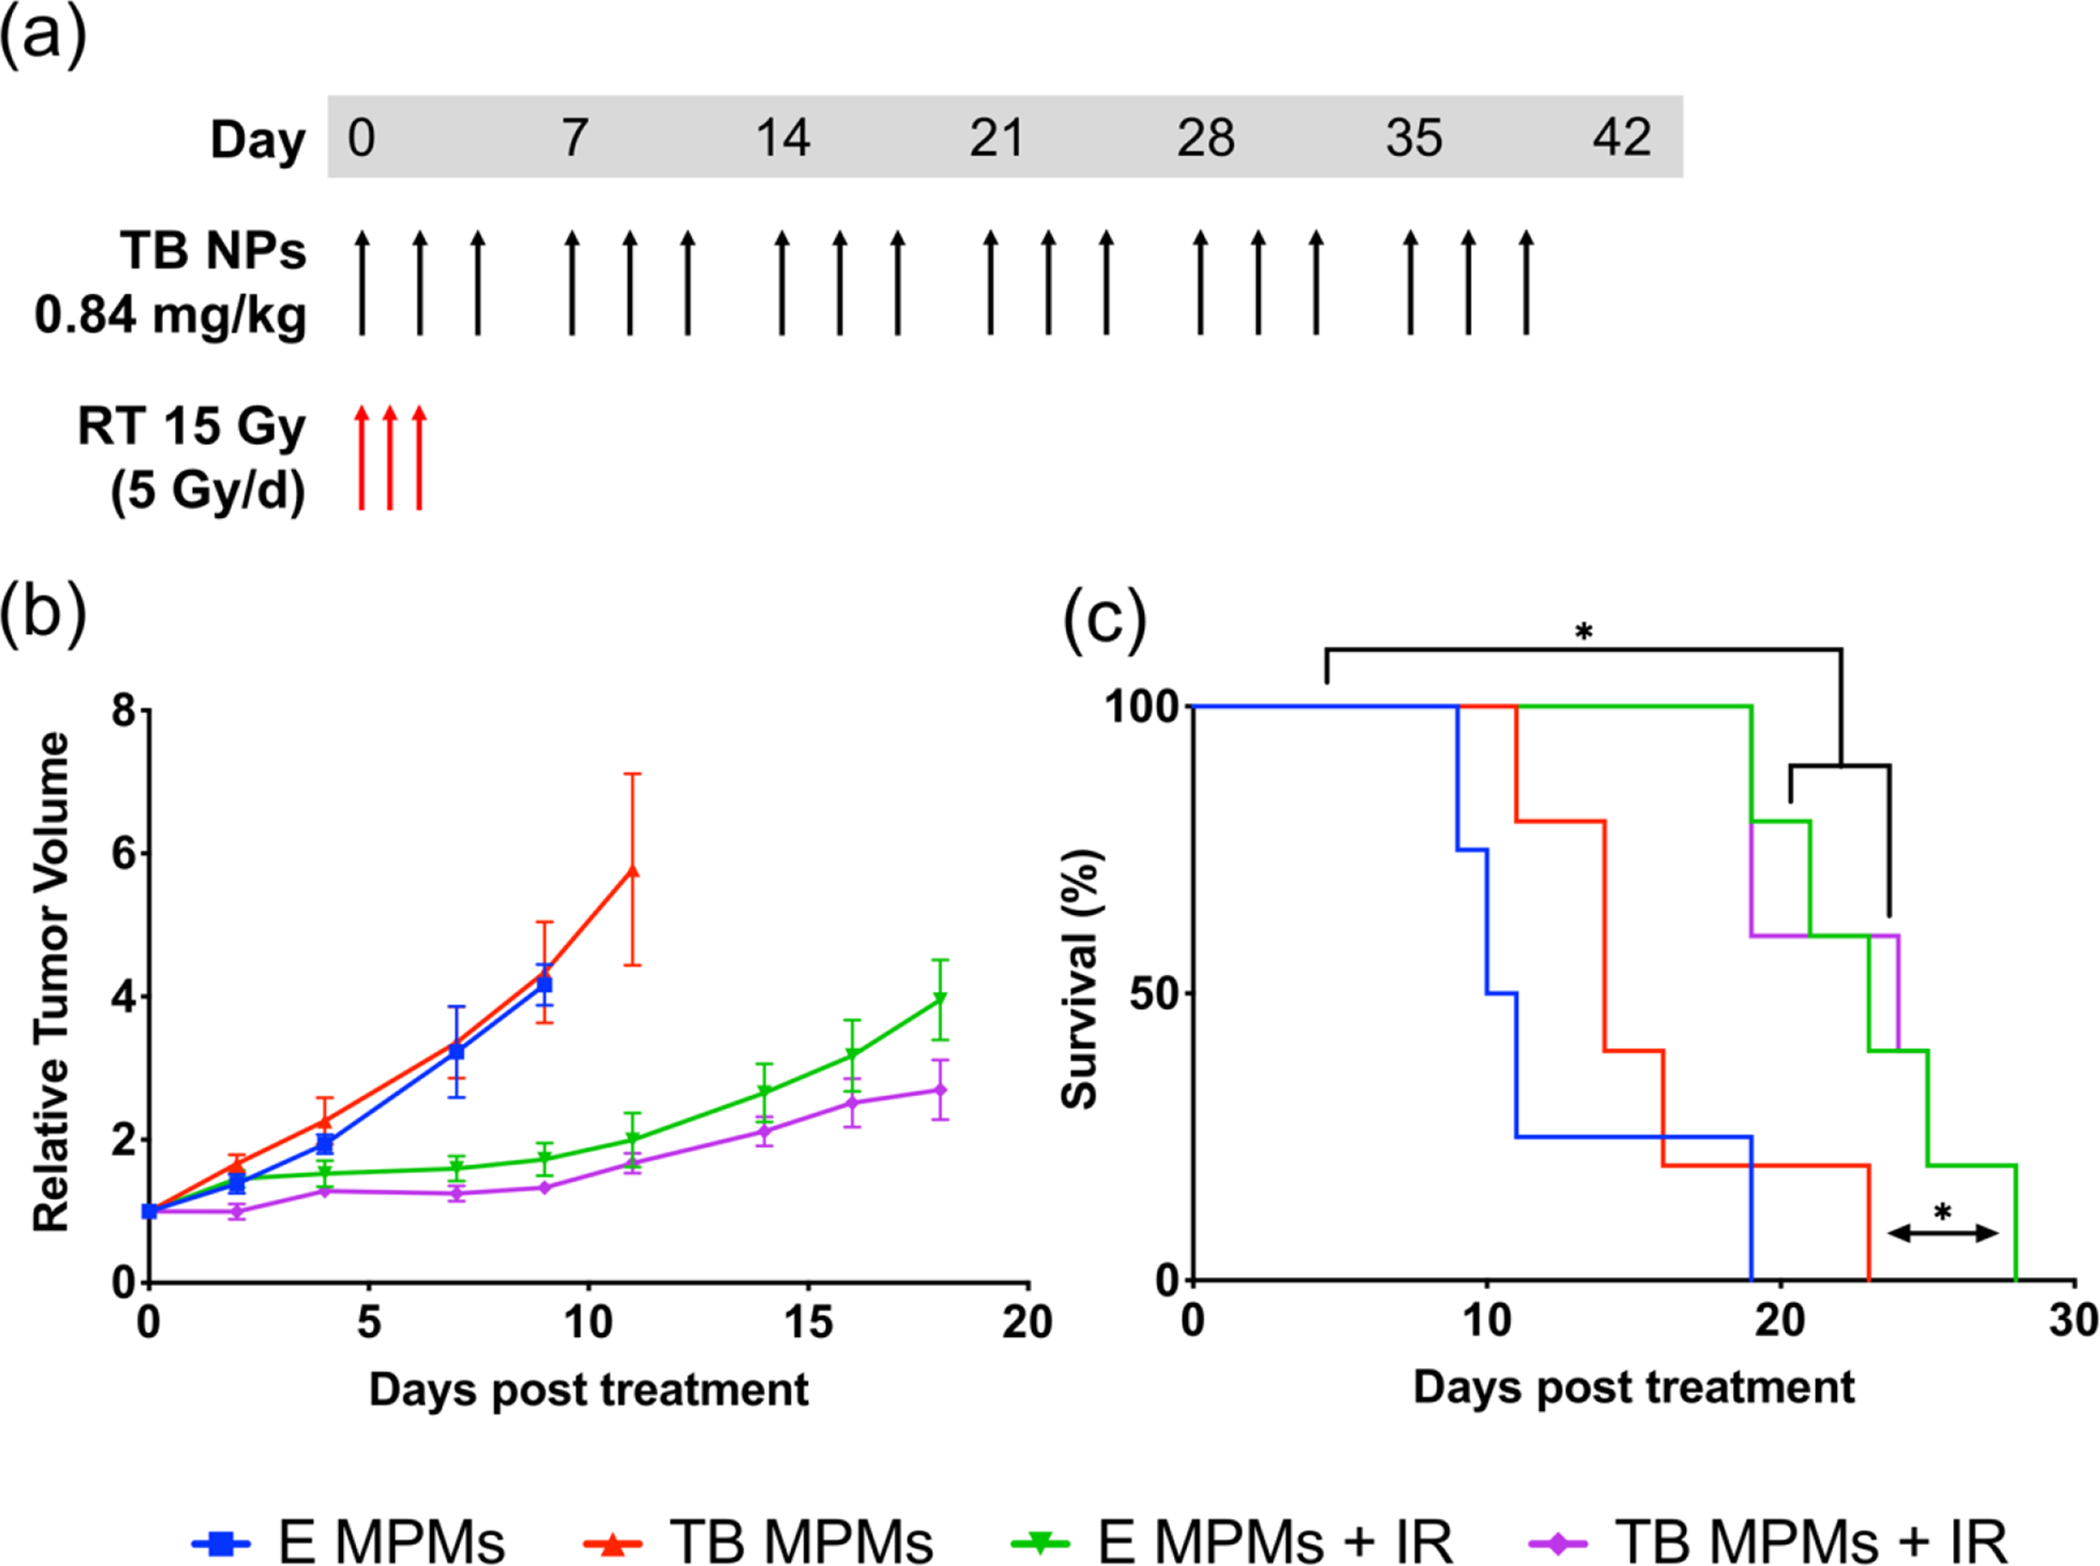
Figure 6.

(a) Therapeutic dosing regimen. (b) Average Relative Tumor Volume. (c) Kaplan-Meier survival curve where differences in survival were calculated according to the logrank (Mantel-Cox) test. * denotes statistically significant difference (p < 0.05).
