Figure 7.

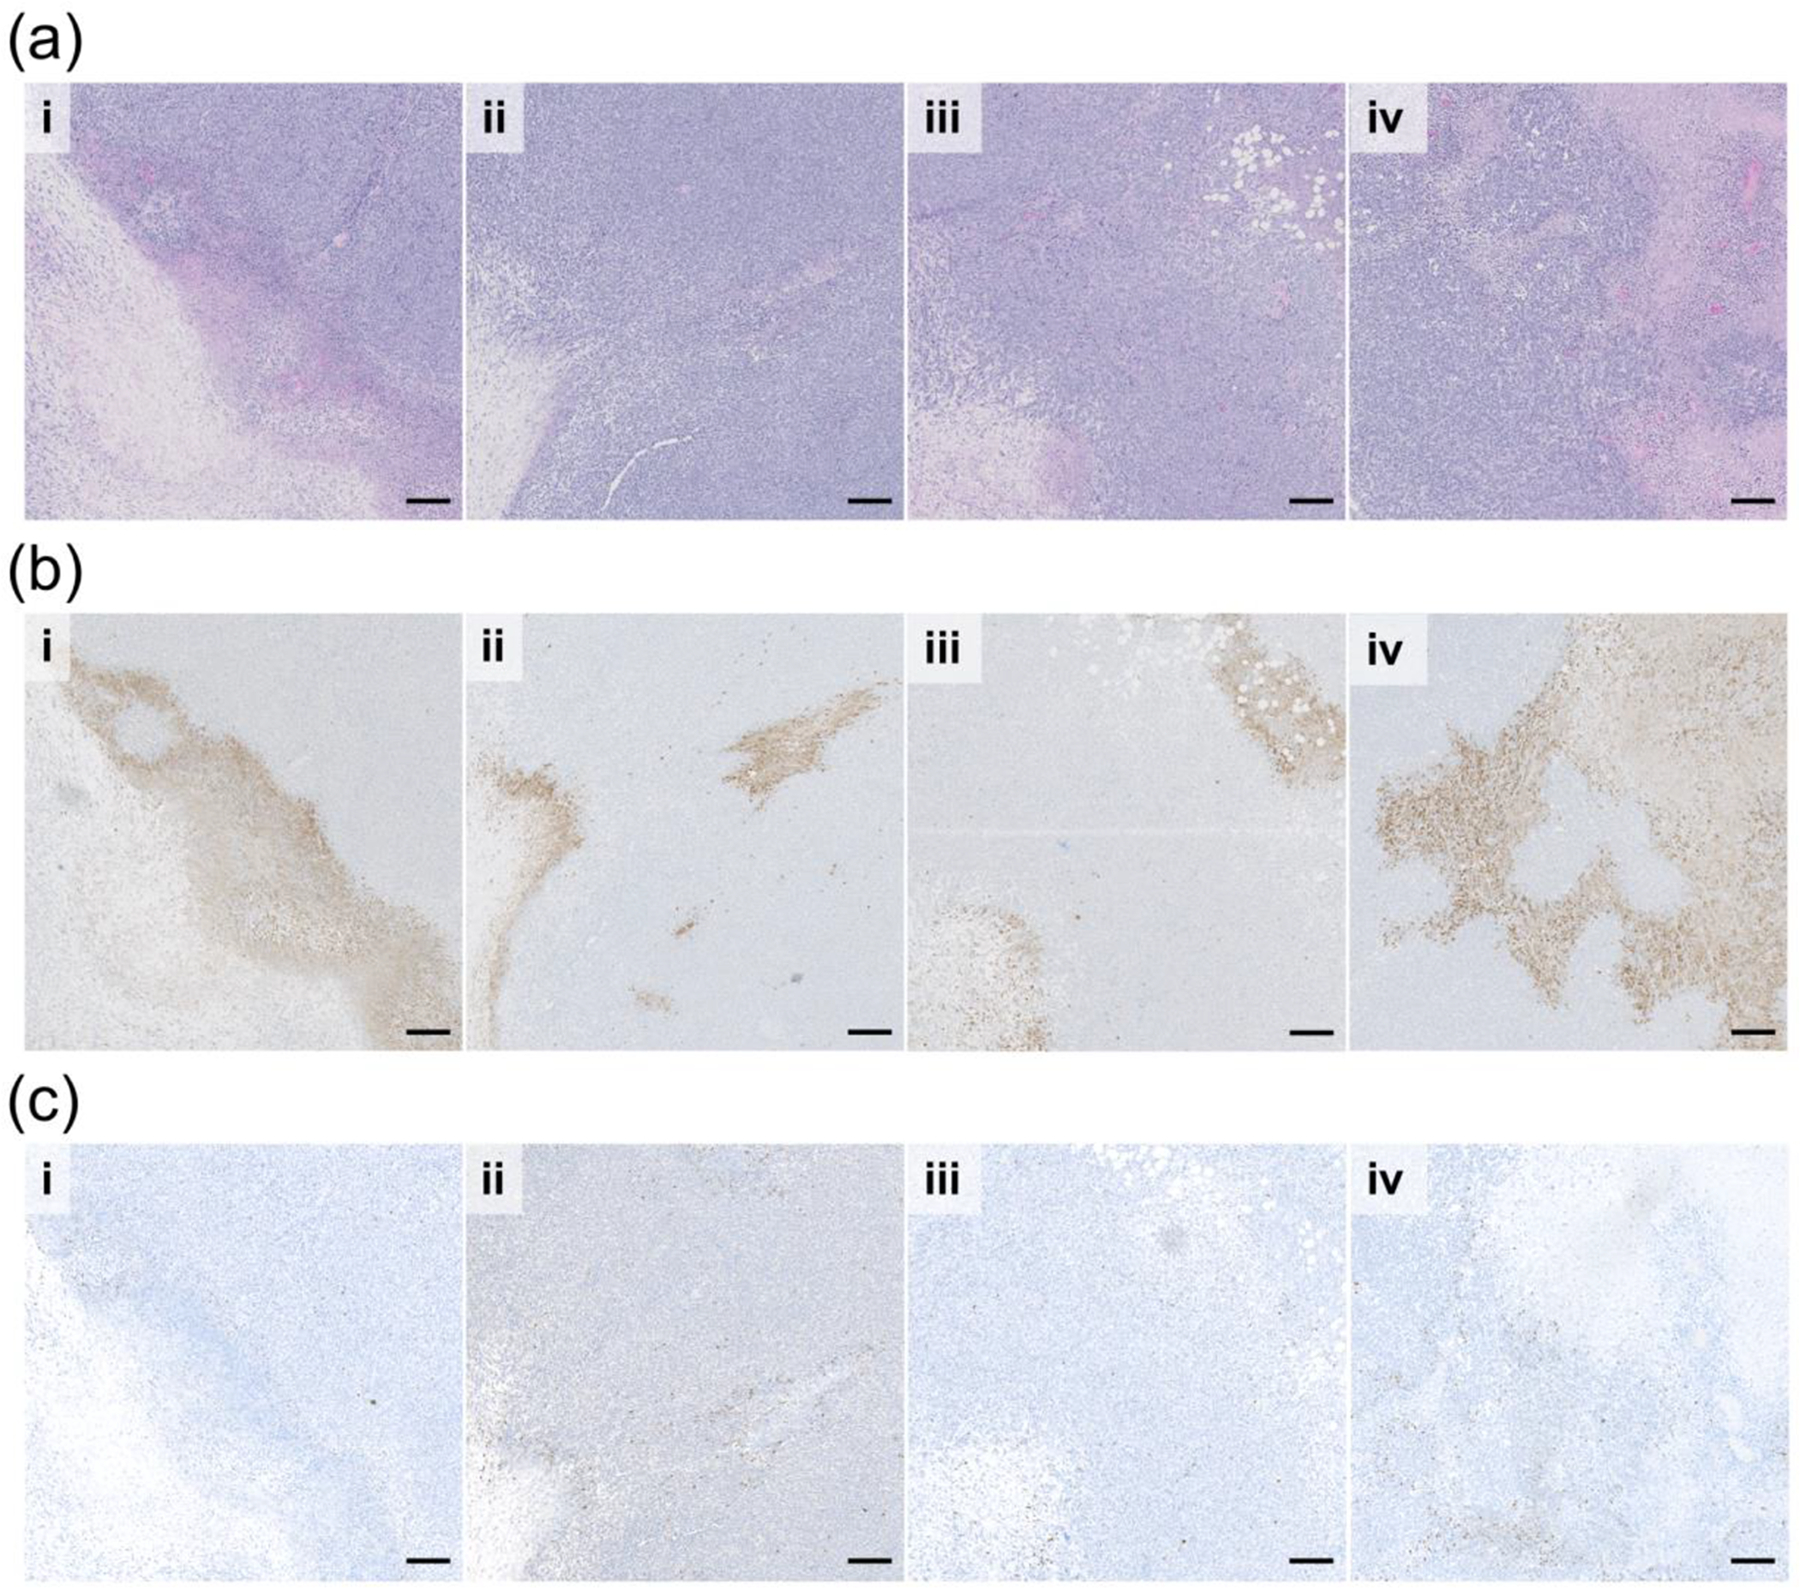
Sequential tumor sections of (a) H&E (b) apoptosis (Cleaved Caspase-3 stained in brown), and (c) DNA Damage (γH2AX stained in brown) evaluation of (i) E MPM (ii) TB MPM (iii) E MPM + IR and (iv) TB MPM+ IR therapeutic regimen efficacy. Scale bar represents 200 microns.
