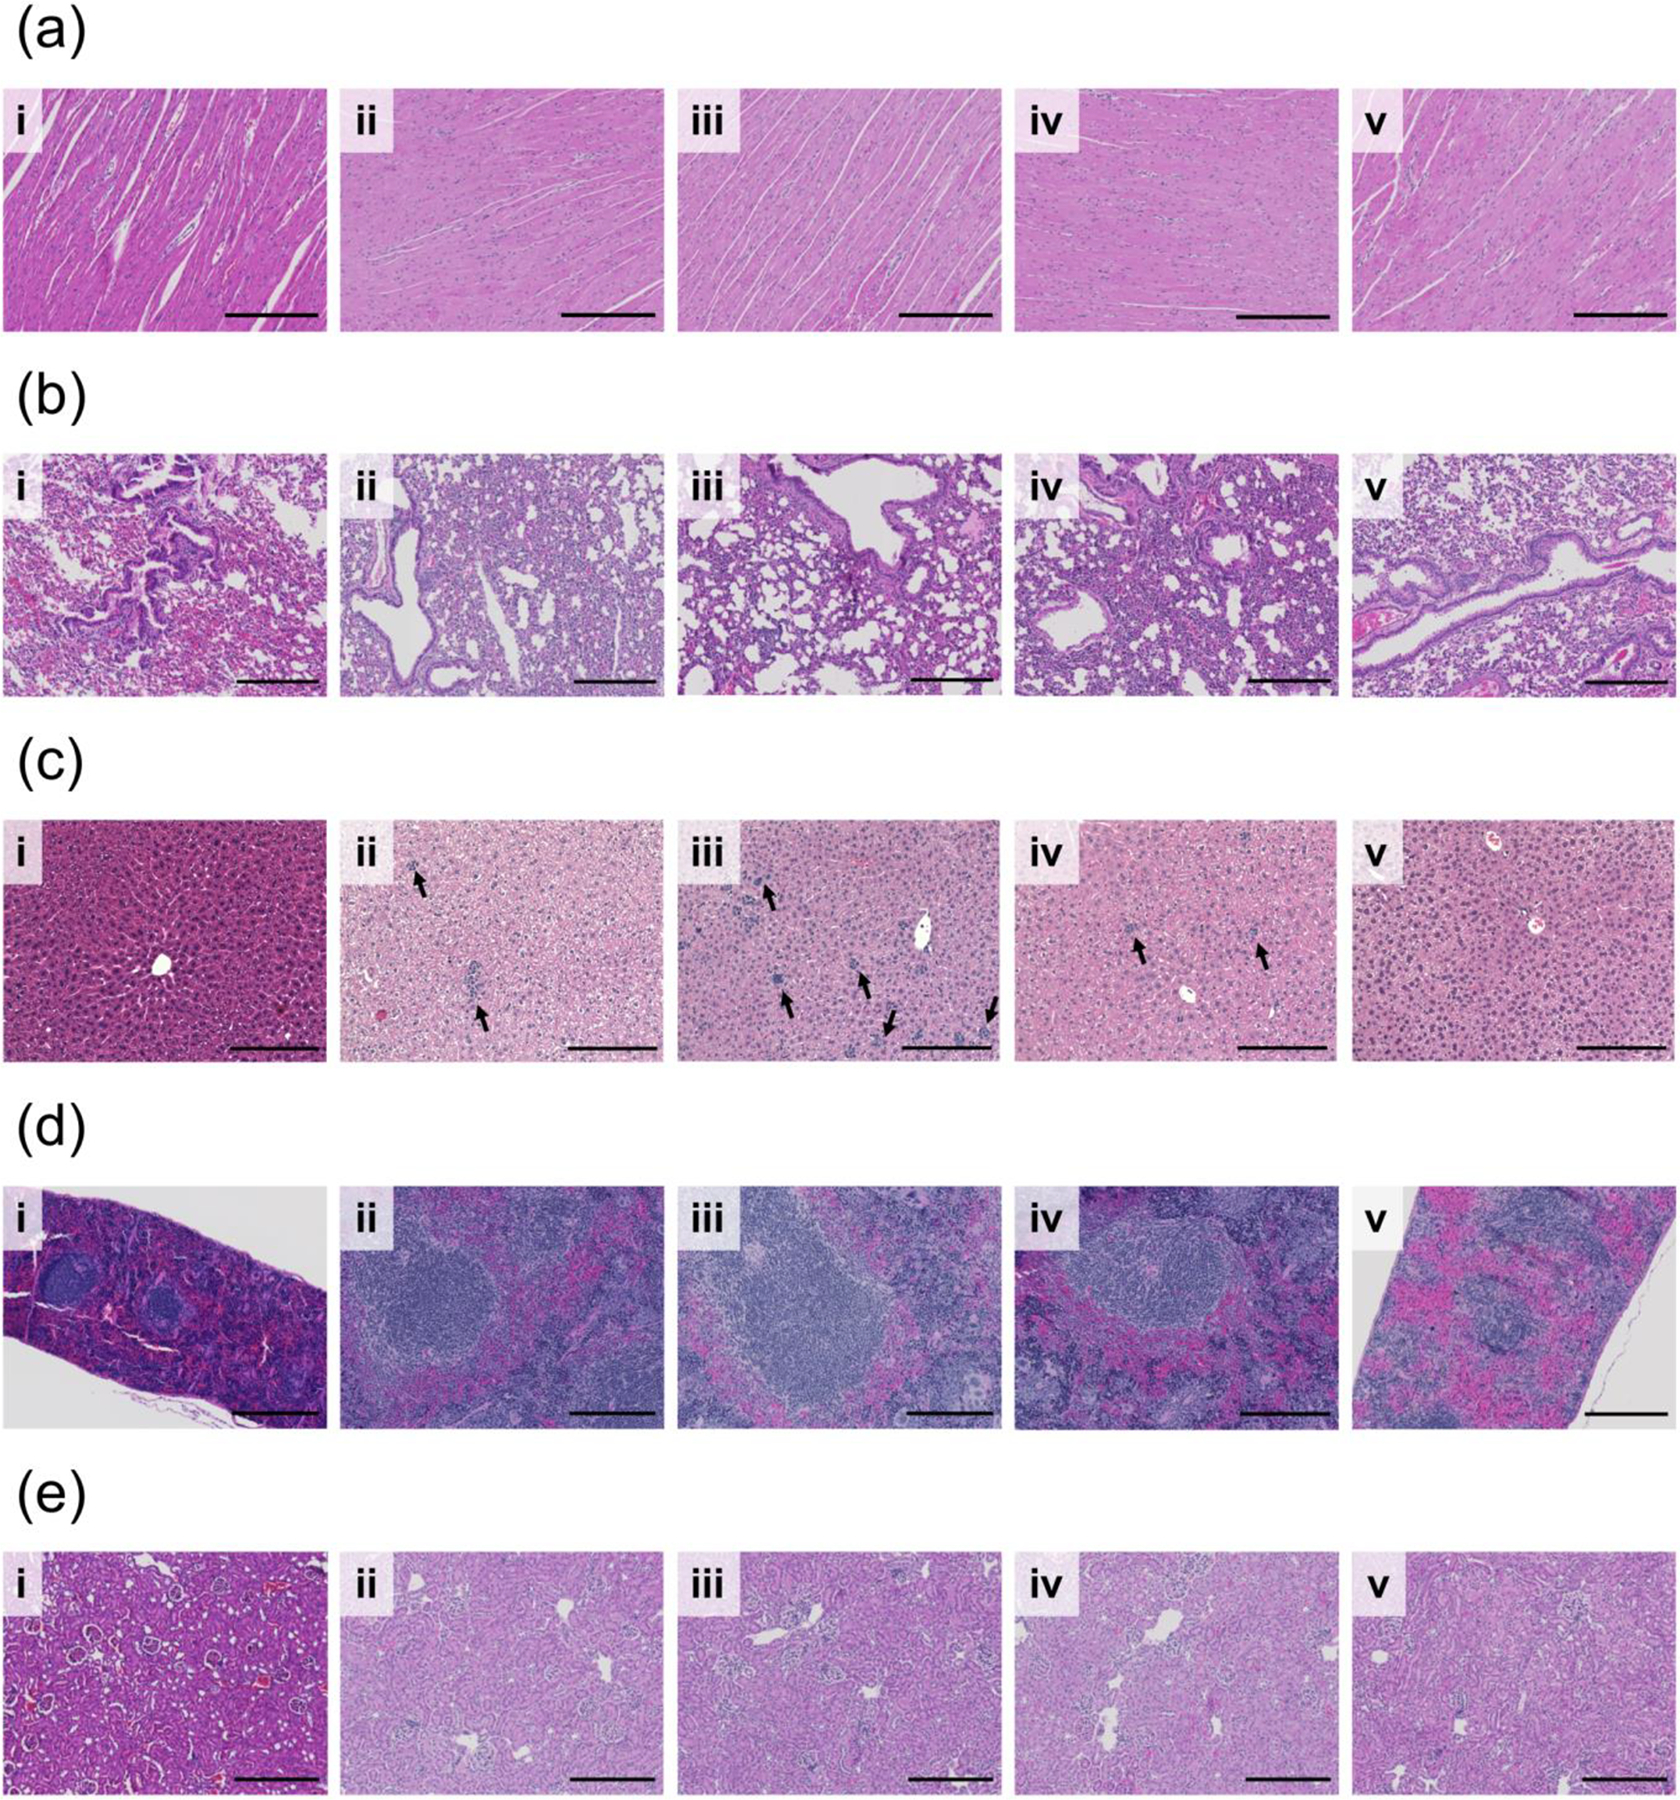
Figure 9.

H&E staining evaluating safety of various treatments (i) naïve (ii) E MPM (iii) TB MPM (iv) E MPM + IR and (v) TB MPM+ IR on vital organs (a) heart (b) lung (c) liver (d) spleen (e) kidney during the course of study. Scale bar represents 200 microns in all images. Arrows identify regions of micrometastasis. Darkness of staining is a function of staining time, rather than histologic differences.
